If \( \cot A = \frac{12}{5}, \) then the value of sin A = ?
\( \frac{5}{13} \)
\( \frac{12}{13} \)
\( \frac{5}{12} \)
\( \frac{13}{12} \)
The given bar diagram represents the number of persons who have taken an insurance policy on the y-axis, and the year of purchase of the insurance policy on the x-axis.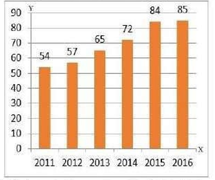
What is the approximate percentage of change in the number of persons who have taken the insurance policy in the year 2014 to that in the year 2011 (correct to one decimal place) ?
If \(
\begin{aligned}
x &= \frac{\sqrt{5} - \sqrt{4}}{\sqrt{5} + \sqrt{4}}
\end{aligned}
\) and \(
\begin{aligned}
y &= \frac{\sqrt{5} + \sqrt{4}}{\sqrt{5} - \sqrt{4}}
\end{aligned} \) then what is the value of \(
\begin{aligned}
\frac{x^{2} - xy + y^{2}}{x^{2} + xy + y^{2}}
\end{aligned}
\)
\( \frac{361}{363} \)
\( \frac{341}{343} \)
\( \frac{384}{387} \)
\( \frac{321}{323} \)
If \( \sin \theta - \cos \theta = \frac{4}{5}, \) then find sin θ + cos θ.
\( \frac{5}{\sqrt{34}} \)
\( \frac{5}{\sqrt{24}} \)
\( \frac{\sqrt{34}}{5} \)
\( \frac{\sqrt{24}}{5} \)
If tan(α+β)=√3, tan(α−β)=1, where (α+β), (α−β) are acute angles, then what is tan(6α)?
If \(
\begin{aligned}
\frac{2p}{p^{2} - 5p + 1} &= \frac{1}{10}
\end{aligned}
\) , \( p \ne 0, \) then the value of value of \(\, \left( p + \frac{1}{p} \right) \,\) is: