Quantitative Aptitude
The pie chart given below shows the number of boys in 8 schools. The total number of boys in all these 8 schools is 6000. Number of boys in particular school is shown as a percent of total number of boys in all these 8 schools.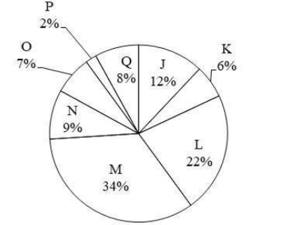
Which of the following statement is correct?
I. The difference between number of boys in school M and Q are 1660.
II. The sum of number of boys in school J, K and L are 2400.
The reminder when 1919 + 20 is divided by 18,is:
What is the value of sin 75° + sin 15°?
\( \frac{1}{\sqrt{2}} \)
\( \frac{\sqrt{3}}{2} \)
\( \sqrt{\frac{3}{2}} \)
\( \frac{3}{\sqrt{2}} \)
The following table shows the number of elected persons from various parties in a state assembly.
| Party |
Years
|
|||||
| 2015 | 2016 | 2017 | 2018 | 2019 | 2020 | |
| P | 62 | 70 | 52 | 90 | 82 | 80 |
| Q | 80 | 90 | 60 | 70 | 76 | 70 |
| R | 90 | 80 | 100 | 50 | 80 | 65 |
| S | 55 | 60 | 70 | 80 | 75 | 72 |
Find the difference between the number of seats won by party R and party Q in all the elections put together.
The table given below shows the number of students joining in 6 different universities.
| Universities | Students |
| A | 275 |
| B | 215 |
| C | 350 |
| D | 250 |
| E | 450 |
| F | 170 |
What is the ratio number of students joining in university A to the number of student joining in university F?
A grocery shop is offering 10% discount on the purchase of Rs.500 and above. A 5% discount is given on the purchase of value above Rs.250 but below Rs.500. A discount of additional 1% is given if payment is made instantly in cash. How much would a customer have to pay by cash if he buys 25 packets of biscuits and one packet is priced at Rs.30?
If the ratio of corresponding sides of two similar triangles is \( \sqrt{5} : \sqrt{7} \) then what is the ratio of the area of the two triangles?
\( \sqrt[3]{5} : \sqrt{7} \)
25:49
\( \sqrt{5} : \sqrt{7} \)
5:7
If cosec θ + cot θ = 2, then what is the value of cosec θ?
In the given figure, ABC is an isosceles triangle with BC=8 cm and AB = AC = 5 cm. The value of tan C - cot B is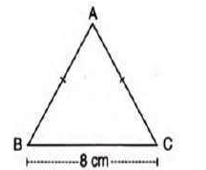
-\( \frac{5}{12} \)
-\( \frac{7}{12} \)
\( \frac{7}{12} \)
\( \frac{5}{12} \)
The LCM of \( \frac{3}{8}, \frac{5}{16} \text{ and } \frac{7}{2} \text{ is:} \) ?
\( 101 \tfrac{1}{2} \)
\( 52 \tfrac{1}{2} \)
\( 28 \tfrac{1}{2} \)
\( 25 \tfrac{1}{4} \)