Quantitative Aptitude
The given table shows the number of new employees joined in different categories of employees in an organisation and also the number of employees from these categories who left the organisation every year since the foundation in 2015. Study the table and answer the question that follows.
| Year |
Business Analysts
|
Accountants
|
Sales Representatives
|
Peons
|
||||
| Joined | Left | Joined | Left | Joined | Left | Joined | Left | |
| 2015 | 80 | 0 | 35 | 0 | 50 | 0 | 73 | 0 |
| 2016 | 63 | 21 | 26 | 16 | 46 | 20 | 34 | 23 |
| 2017 | 73 | 28 | 15 | 5 | 38 | 15 | 48 | 29 |
| 2018 | 42 | 39 | 20 | 38 | 34 | 0 | 14 | 12 |
| 2019 | 67 | 44 | 14 | 24 | 22 | 30 | 21 | 30 |
Aarif, Arun and Abraham can do a work in 12, 20 and 24 days, respectively. They all begin together. Aarif leaves the work 1 day, Arun 3 days and Abraham 4 days before its completion. In how many days is the work finished?
The following pie chart shows the % of emplyees in each department and the % of males working in each department.
Find the number of females working in the production department.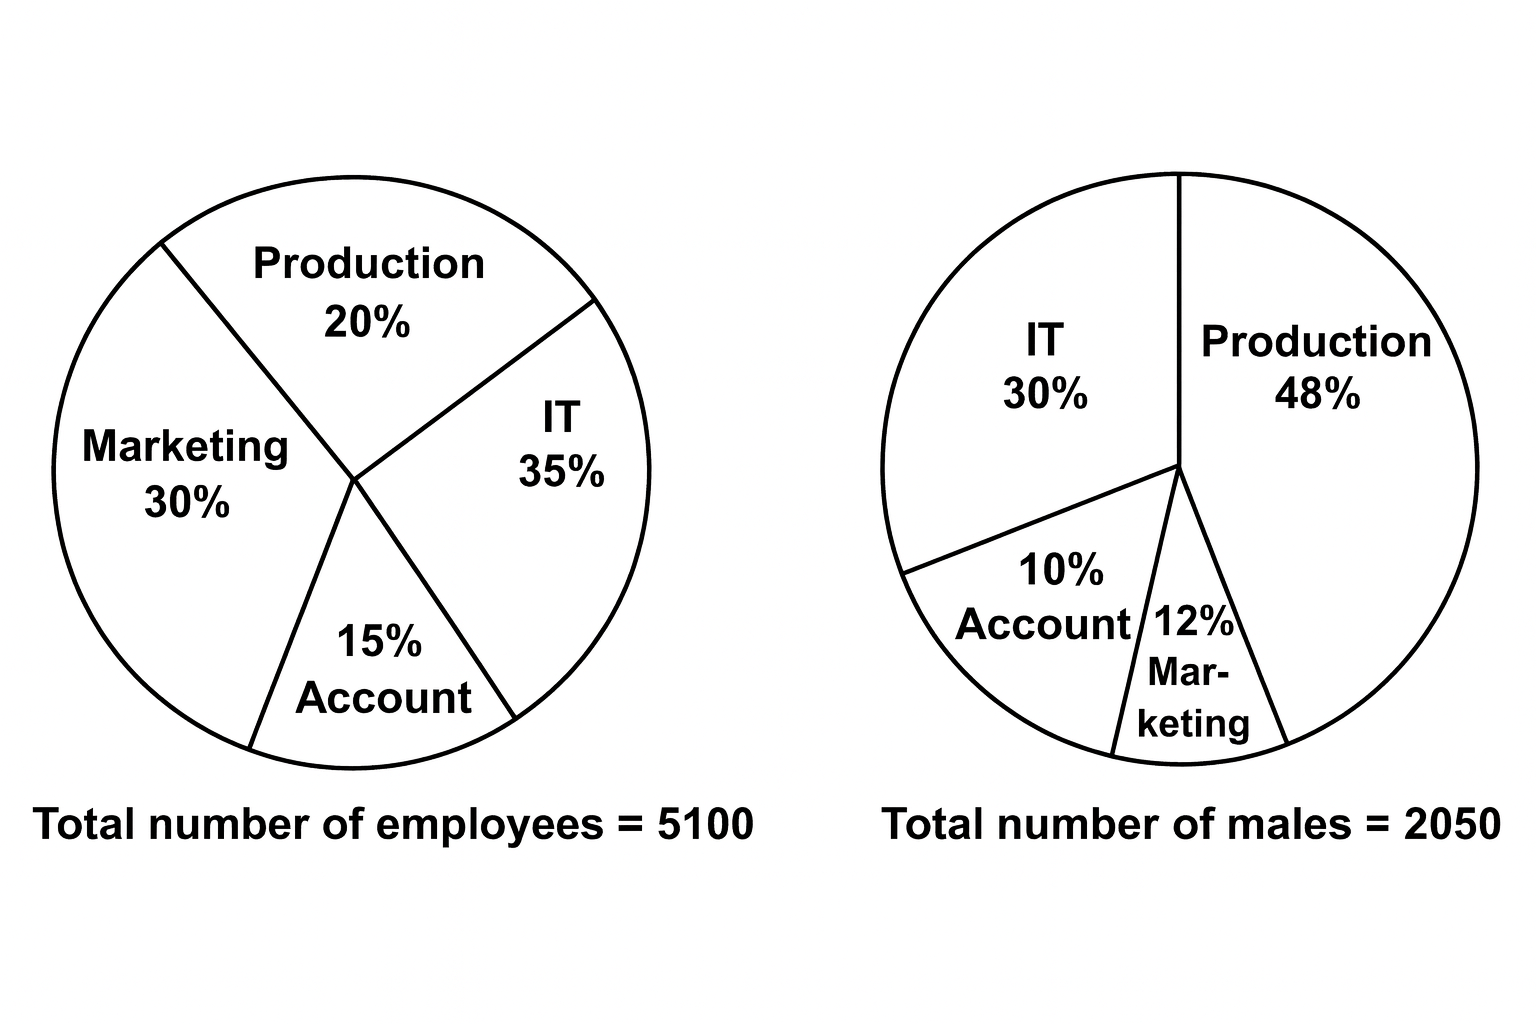
If x = 222, y = 223 and z = 224, then find the value of x3 + y3 + z3 - 3xyz.
The bar graph given below shows the percentage distribution of total production of six different types of cars by a car manufacturing company over 2 years.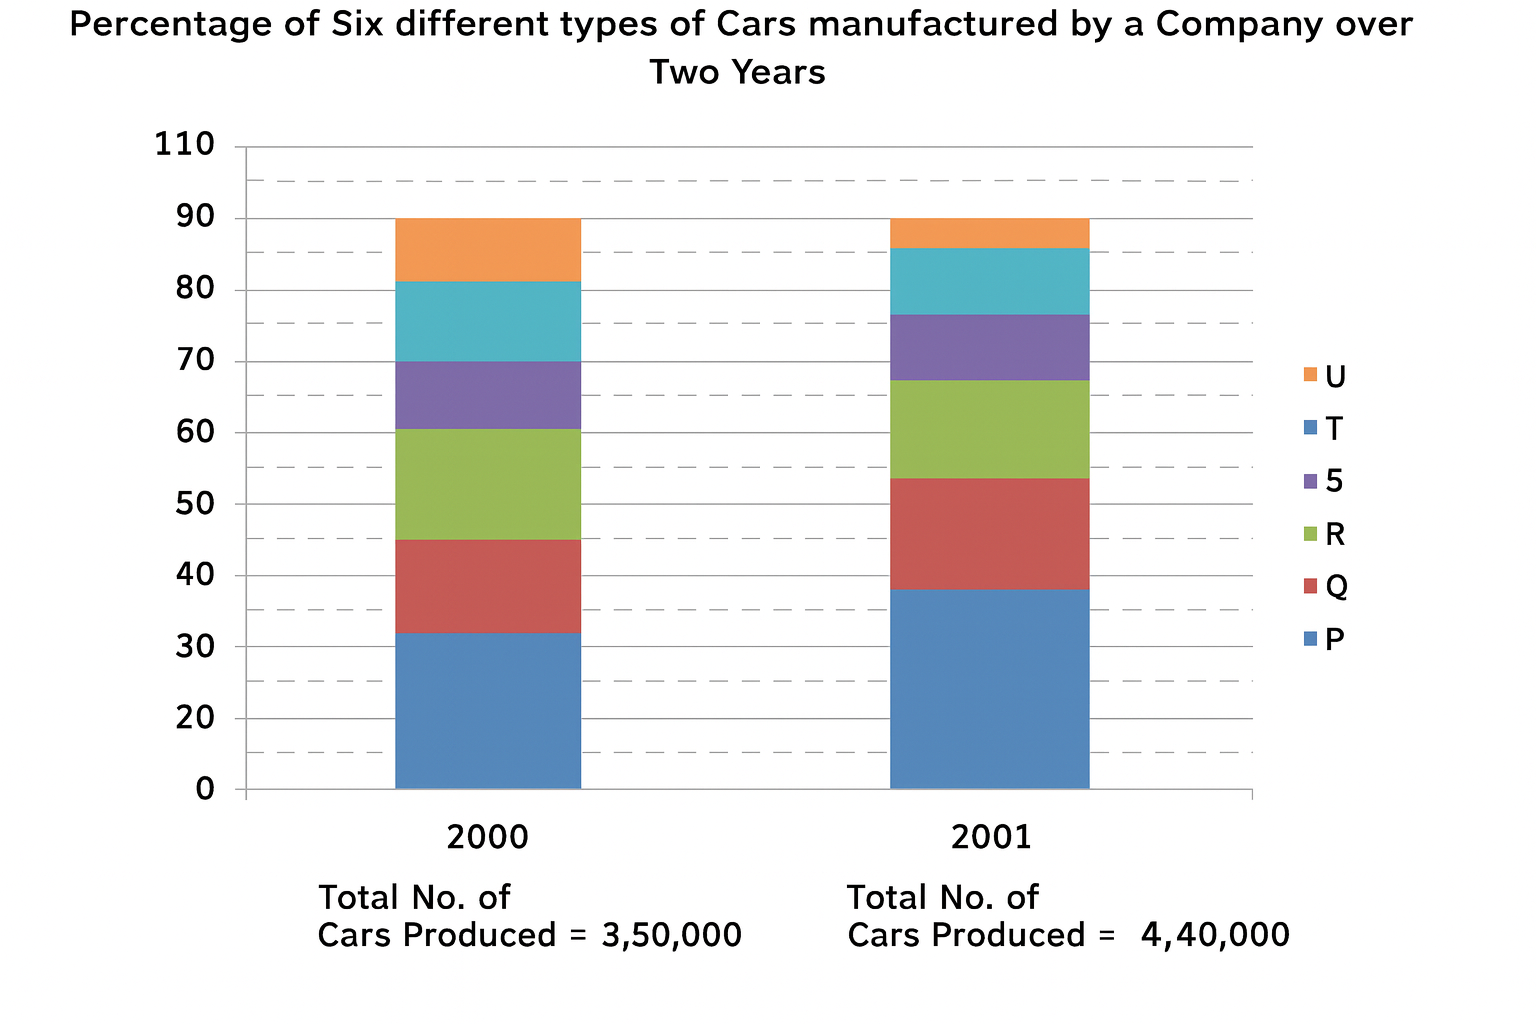
The total number of cars of type P, R and U manufactured in 2001 is:
If secA = \( \frac{5}{4} \) , then value of \(\frac{\tan A}{1 + \tan^2 A} - \frac{\sin A}{\sec A}\) is:
The following pie chart shows the population of 7 villages.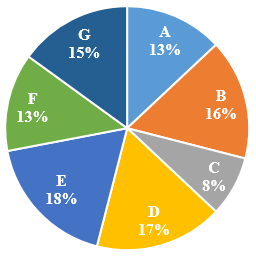
What is the difference between the population of villages E and D if the total population of all the villages together is 50,000?
If α, β are the roots of 6x² + 13x + 7 = 0, then the equation whose roots are α², β² is:
36x² - 87x + 49 = 0
36x² - 85x + 49 = 0
36x² - 85x - 49 = 0
36x² + 87x - 49 = 0