The bar graph shows percentage distribution of total production of six different types of cars by a car manufacturing company over 2 years.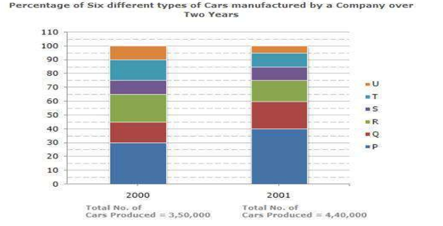
If 75% of the T type cars produced in each year were sold by the company, how many T type cars remain unsold?
The table shows number of working days of a company in 5 years.
| Years | Working days |
| P | 110 |
| Q | 310 |
| R | 160 |
| S | 60 |
| T | 210 |
What are ratio of number of working days in year R to the number of working days in year T?
The table shows number of salesman in 5 companies.
| Companies | Salesman |
| J | 45 |
| K | 20 |
| L | 40 |
| M | 15 |
| N | 25 |
Number of salesman in J is what percent of the number of salesman in K?
Study the graph and answer the question.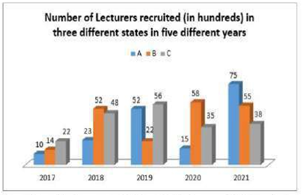
The number of lecturers recruited in state B in the year 2019 was what percentage of the number of lecturers recruited in state C in the year 2021? (Correct to 2 decimal places.)