Sita gets a discount of 20% on ₹3,000 juicer mixer machine. Since she pays cash, she gets additional 5% discount too. How much does she pay?
The pie chart given below shows the production of 6 different factories. The total production of all these 6 factories is 15000. The production of a particular factory is shown as a percent of total production of all these 6 factories.
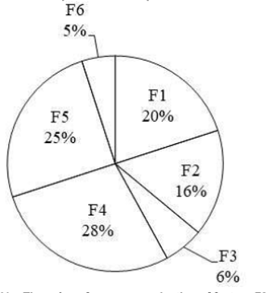
J1 = The value of aerage production of factory F3 and F6.
J2 = The difference between the production of factory F1 and F4.
What is the value of (J2 - J1)?
What is the value of
\(
\frac{\cos A}{1 - \tan A} + \frac{\sin A}{1 - \cot A}\) = ________.
In the following bar diagram, there are 5 companies A,B,C,D,E. The diagram shows the demand of a product and its production the above five companies.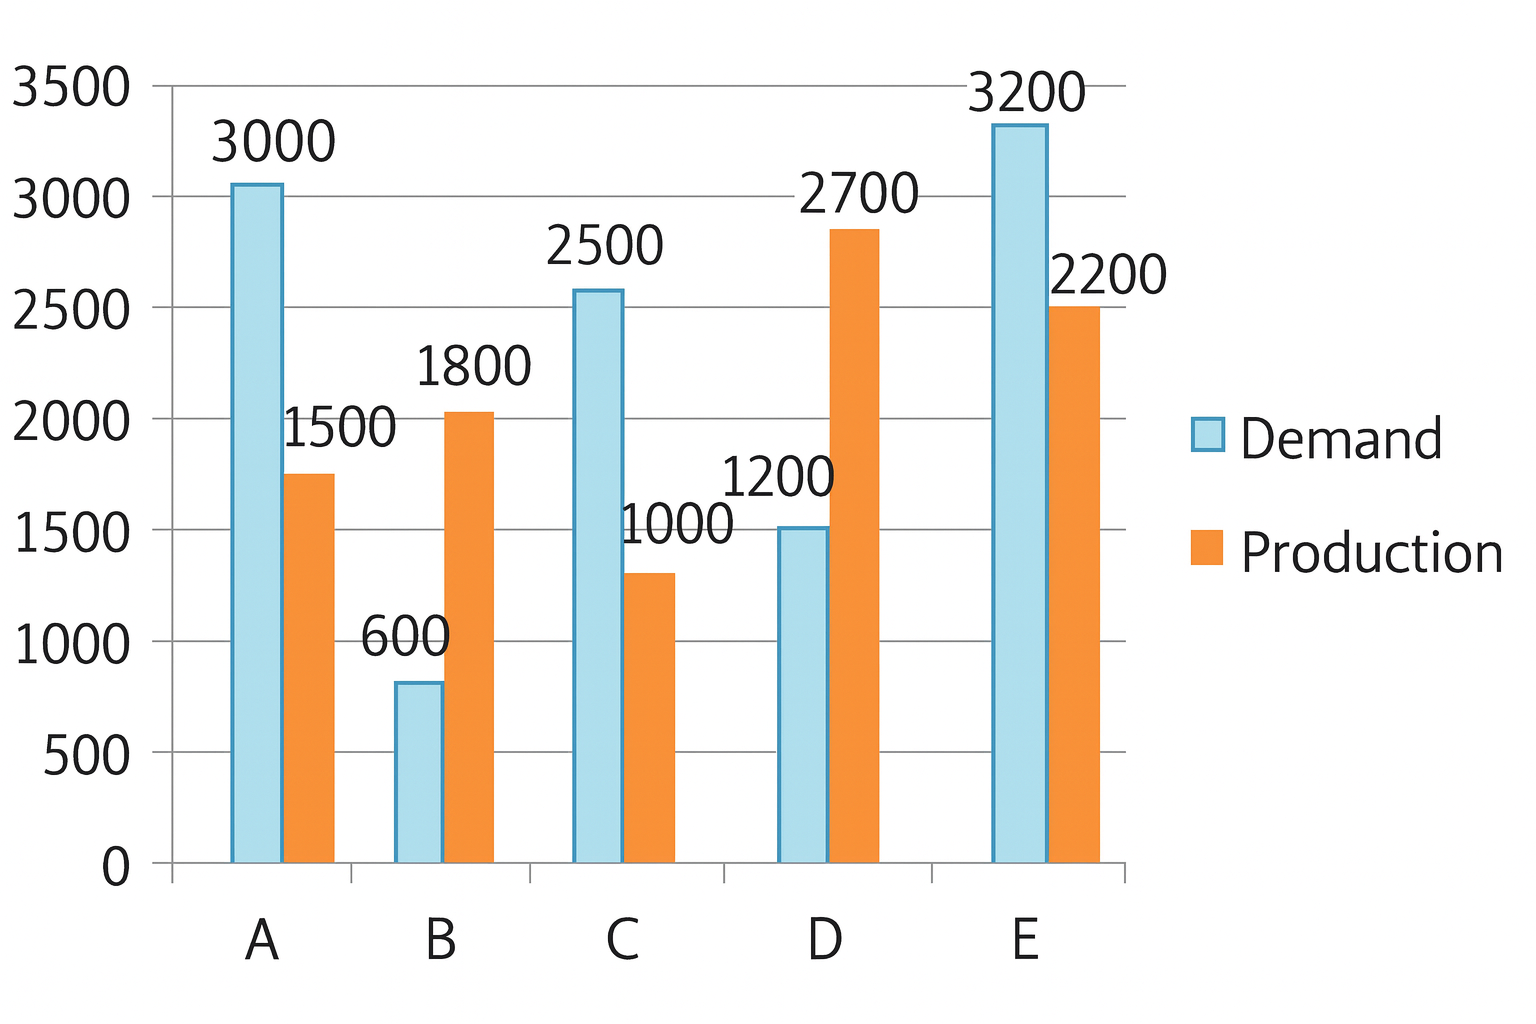
If x% of the demand of the product by Company C is equal to that of the Company B, then find the value of x.