Quantitative Aptitude
Study the bar graph and answer the question that follows.
The bar graph shows the sales of cycles (in 1000 numbers) from 4 different companies during 2018.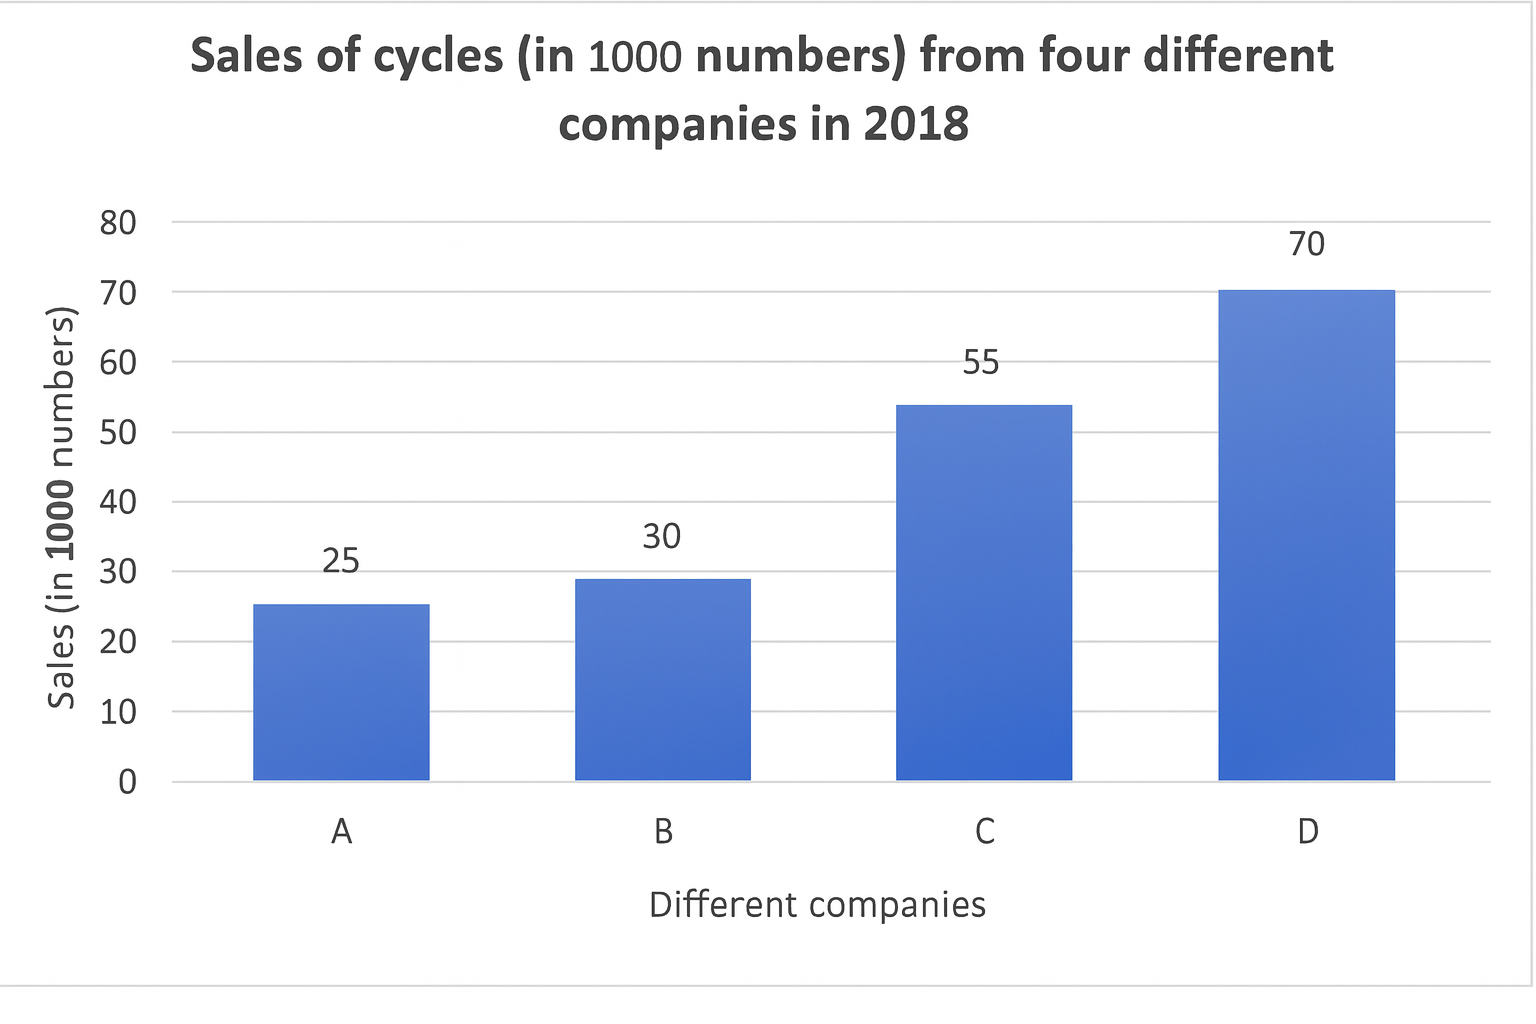
What is the average sales of all the companies (in 1000numbers) for 2018?
The following table shows the number of sweets manufactired by 6 factories.
| Year |
Factory
|
|||||
| P | Q | R | S | T | U | |
| 1996 | 196 | 145 | 254 | 169 | 291 | 220 |
| 1997 | 172 | 233 | 141 | 125 | 167 | 189 |
| 1998 | 178 | 240 | 150 | 130 | 177 | 192 |
| 1999 | 180 | 260 | 160 | 140 | 188 | 195 |
What is the respective ratio of sweets manufactured by factories P,Q and R together in the year 1998, to the sweets manufactured by factories S,T and U together in the same year ?
The ratio between the monthly income and the expenditure of Vaidic is 8: 5. If his income increases by 20% and his expenditure increases by 30%, then find the percentage increase or decrease in his monthly savings.
\(5\dfrac{2}{3}\) % increase
\(5\dfrac{2}{3}\) % decrease
\(3\dfrac{1}{3}\) % increase
\(3\dfrac{1}{3}\) %decrease
Simplify the following expression.
(2x7-5+9÷3)÷(4+2)2 x2
If ₹72 amounts to ₹104.4 in 3 years, what will ₹120 amount to in 5 years at the same rate percent per annum?
In the given figure. 'G' is the centre of the circle. Find the angle ACB when <AGB = 132°.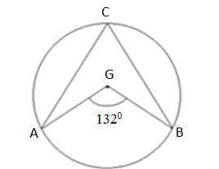
Pipe A can fill an empty tank in 18 hours and pipe B can fill the same empty tank in 24 hours. If both the pipes are opened simultaneously, how much time (in hours) will they take to fill the empty tank?
\(11\dfrac{3}{7}\)
\(10\dfrac{1}{7}\)
\(10\dfrac{2}{7}\)
\(11\dfrac{2}{7}\)