Section : Quantitative Aptitude
If the simple interest on a certain sum of money borrowed for 4 years at 9.5% per annum exceeds the simple interest on the same sum for 3 years at 12.5% per annum by ₹225, then the sum borrowed is:
The following pie chart represents the percentage-wise distribution of 300 students of class X in a school in six different sections A, B, C, D, E and F.
The given table shows the number of boys of class X in six different sections A, B, C, D, E and F.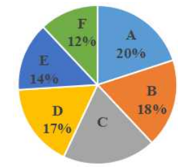
| Section | A | B | C | D | E | F |
| No. of Boys | 36 | 26 | 34 | 28 | ----- | 20 |
The total number of boys in sections A, B and D together is what percentage more than the total number of girls in sections A, B and D together?
If the adjacent sides of a rectangle whose perimeter is 60 cm are in the ratio 3 : 2, then what will be the area of the rectangle?
If \(x + \frac{81}{x} = 18\) ,where x > 0, then the value of \(x^{2} + \frac{162}{x^{2}}\) is:
Study the given pie chart and answer the question that follows.
The pie chart shows the distribution (degree wise) of the number of computers sold by a shopkeeper during five months.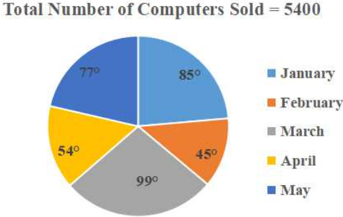
By what percentage is the total number of computers sold in February and March more than the number of computers sold in April and May (correct to one decimal place)?