Section : Quantitative Aptitude
Study the given graph and answer the question the follows.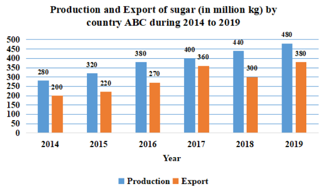
What is the ratio of the total production of sugar in 2014 and 2018 to the total export in 2015 and 2019?
If \(\dfrac{\csc\theta + \cot\theta}{\csc\theta - \cot\theta}\) = 7 , then the value of \(\dfrac{4\sin^{2}\theta + 5}{4\sin^{2}\theta - 1}\) is:
If a + b + c = 5 and a3 + b3 + c3 -3abc = 185, then the value of ab + bc + ca lies between:
Study the given graph and answer the question that follows.
The bar graph shows the percentage distribution of total expenditure of a company under various expense heads during a year.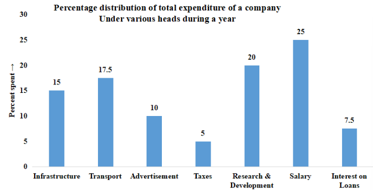
The total expenditure of the company in the year is how many times the expenditure on Research & Development?
If 2x2 - 6x = 1, then \(x^{2} + \dfrac{1}{4x^{2}}\) =?