If 5 sin2 θ = 3(1 + cos θ), 0° < θ < 90°, then the value of cosec θ + cot θ is:
\(\dfrac{4}{\sqrt{21}}\)
\(\sqrt{\dfrac{3}{7}}\)
\(\dfrac{5}{\sqrt{21}}\)
\(\sqrt{\dfrac{7}{3}}\)
Study the given bar graph and answer the question that follows.
The given bar graph represents the Sales Turnover (in ₹ crore) of five automobile companies A, B. C, D and E during 2014-2015 and 2015-2016. The X-axis represents the Companies, and the Y-axis shows the Sales Turnover (in ₹ crore).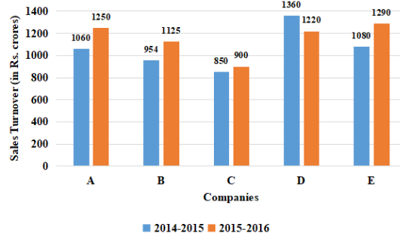
(The data shown here is only for mathematical exercise. They do not represent the actual figures of the company.) By what percentage is the average sales turnover of all the companies combined in 2015-2016 more than the average sales turnover of the companies A, C and E in 2014-2015 (to the nearest whole number)?
The given pie chart represents the percentage-wise distribution of 300 students of class X in a school in six different sections A, B, C, D, E and F.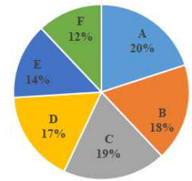
The given table shows the number of boys of class X in six different sections A, B, C, D, E and F.
If in section E, the ratio of boys and girls is 4 : 3. then the ratio of the number of girls in section B to that of the number of girls in section E is:
| Section | A | B | C | D | E | F |
| No. of boys | 36 | 26 | 34 | 28 | ...... | 20 |
If cot θ = \(\sqrt{2}\) + 1, then cosec θ sec θ =?
\(\dfrac{\sqrt{2}}{2}\)
\(\dfrac{\sqrt{2}}{4}\)
\(2\sqrt{2}\)
\(4\sqrt{2}\)