If x4 -142x2 + 1 = 0, then the value of \(x^{3} + \dfrac{1}{x^{3}}\) is:
Study the given table and answer the question that follows.
The table shows the annual consumption (in hundred tonnes) of tea in five states (A, B, C, D and E) across six years (2014 to 2019).
The consumption of tea in which state and year is closest to the average consumption of tea in State A over six years?
| State → Year ↓ |
A | B | C | D | E |
| 2014 | 112 | 130 | 136 | 105 | 117 |
| 2015 | 122 | 138 | 150 | 140 | 120 |
| 2016 | 124 | 134 | 142 | 144 | 132 |
| 2017 | 132 | 154 | 198 | 149 | 133 |
| 2018 | 135 | 148 | 187 | 151 | 145 |
| 2019 | 153 | 136 | 198 | 150 | 187 |
Train A takes \(1\dfrac{4}{5}\) h more than the time taken by train B to cover a distance of 360 km. If the speed of train A doubles, it will take 36 min less than the time taken by train B to travel the same distance. What is the speed (in km/h ) of train B?
Study the given graph and answer the question that follows.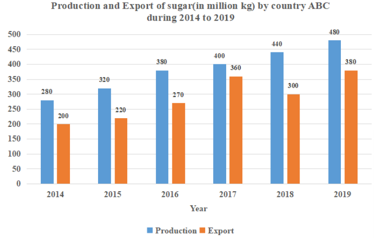
By what percentage is 80% of the total export of sugar in 2016, 2017 and 2019 more than the total production in 2015 and 2018 (correct to one decimal place)?
A wire is bent to form a square of area 169 cm². If the same wire is bent to form circle, then what is its area (in cm², to the nearest whole number)? \(\text{Take }\pi = \dfrac{22}{7}\)
If tan A =\(\dfrac{1.1}{6}\) , then what is the value of (4 cos A − 7 sin A)? Given that A is an acute angle.
\(2\dfrac{14}{61}\)
\(2\dfrac{41}{71}\)
\(2\dfrac{14}{71}\)
\(2\dfrac{41}{61}\)
Study the given bar graph and answer the question that follows.
The given bar graph represents the Sales Turnover (in ₹ crore) of five automobile companies A, B, C, D and E during 2014-2015 and 2015-2016. The X-axis represents the Companies, and the Y-axis shows the Sales Turnover (in ₹ crore).
(The data shown here is only for mathematical exercise. They do not represent the actual figures of the company.)
Which two companies have the same percentage increase in the sales turnover from 2014-2015 to 2015-2016?