Section : Quantitative Aptitude
The given line graph shows the production (in tonnes) and the sales (in tonnes) of a company.
What is the difference (in tonnes) in the production in 2015 and 2017 taken together and the sales in 2018 and 2019 taken together?
If x8 - 2599x4 + 1 = 0, then the positive value of \(x-\dfrac{1}{x}\) will be:
solve the following equation.
\(2\sqrt{3}\sin^{2}\theta+\cos\theta-\sqrt{3}=0\)where θ is an acute angle.
If sec = \(\sec\left(90^{\circ}-\dfrac{3\theta}{2}\right)=\sqrt{2}\), 0° < θ < 90°, then the value of 2 sin θ + 4 cos 2θ will be:
If the diameter of the base of a cone is 18 cm and its curved surface area is \(424\dfrac{3}{7}\,\text{cm}^{2}\) , then its height will be: \(\text{(Take } \pi=\dfrac{22}{7}\text{)}\)
If a + b + c = 4, ab + bc + ca = -14 and abc = -18, then the value of \(\sqrt{4a^{3}+4b^{3}+4c^{3}-36}\) will be:
The given bar-graph shows the number of boys and girls in classes A, B, C and D in a school, the number of teachers allotted to each class and the number of students promoted to the next class.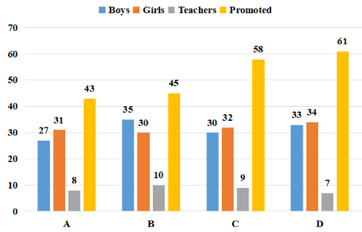
Which class has the highest percentage of failed students?