The given bar graph indicates the production of sugar (in lakh tonnes) by three different sugar companies P, Q and R from the year 2015 to 2019. Study the bar graph and answer the question that follows. Production of sugar by companies P, Q and R from 2015 to 2019.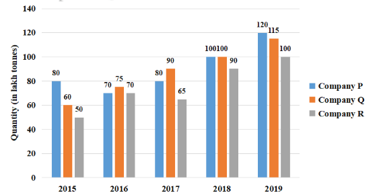
The ratio of the average production of sugar by company P from the year 2015 to 2019 to the average production of sugar by company R from the year 2015 to 2019 is:
Study the given bar graph and answer the question that follows. The bar graph shows the production of table fans in a factory for one week.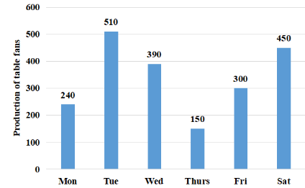
The ratio of the total production of table fans on Tuesday and Wednesday together to that on Thursday and Friday together is:
From a point P that is at a distance of 15 cm from centre O of a circle of radius 9 cm, in the same plane, a pair of tangents PQ and PR is drawn to the circle. The area of quadrilateral PQOR is: