Quantitative Aptitude
Study the following bar graph that shows the number of students enrolled for different courses in institutes A and B during 5 years, and answer the question that follows.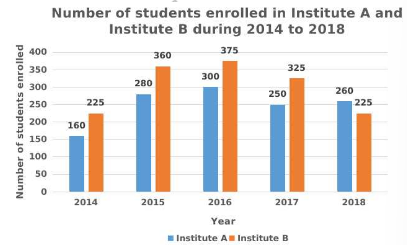
What is the ratio of the total numbers of students enrolled in A during 2017 and 2018 to that of students enrolled in B during 2014 and 2015?
The marked price of an article is ₹400. After allowing a discount of 20% on the marked price, a shopkeeper makes a profit of ₹48. His gain percentage is:
\(15\tfrac{11}{17}\%\)
\(19\tfrac{11}{17}\%\)
\(17\tfrac{11}{17}\%\)
\(14\tfrac{11}{17}\%\)
'A' is 3 times as good a workman as 'B' and therefore is able to complete a job in 36 days less than 'B'. In how many days will they finish it working together?
\(12\tfrac{1}{2}\)
\(15\tfrac{1}{2}\)
\(14\tfrac{1}{2}\)
\(13\tfrac{1}{2}\)
A certain sum is divided among A, B, C and D such that B' share is \(\tfrac{1}{2}\) of A's share, C's share is 40% of B's share, and D's share is 50% of C's share. If the difference between the shares of B and D is ₹1600 then the sum is: