Study the following bar graph that shows the number of students enrolled for different courses in institute A and B during 5 years, and answer the question that follows.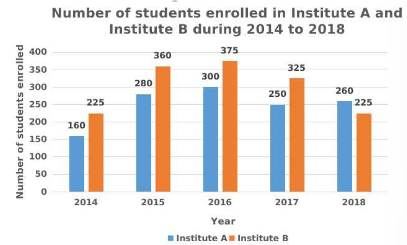
The number of students enrolled in A during 2014, 2016 and 2018 is what percentage of the total number of average students enrolled in B during the 5 years (correct to one decimal place) ?
₹63,800 is to be divided between A and B in the ratio 4:7. The difference between their shares (in ₹) is:
The length of a rectangle is three- fifth of the radius of a circle. The radius of the circle is equal to the side of a square whose area is 6400 m2 . The area (in m2) of rectangle, if the breadth is 20 m is:
Due to 20% reduction in the price of wheat per kg, Ram is able to buy 5 kg more for ₹800. What is the original price (in ₹)of wheat per kg?
A rectangular room has an area of 60 m2 and perimeter of 34 m.The length of the diagonal of the rectangular room is same as the side of a square.The area of the square (in m2 )
A person borrows ₹75,000 for 3 years at 5% simple interest. He lends it to B at 7% for 3 years. What is gain (in ₹)?
A train takes 1 hour 20 minutes to travel between two stations, P and Q. If it travels at \(\tfrac{5}{6}\) of its usual speed,how long will it take to travel between P and Q?