If 162 : x :: x : 338 find the positive value of x.
The following table shows the number of children from 4 different schools who like 4 different types of fruits. All the children like only one of the given fruits.
| School | No. of children who likes | |||
| Apple | Orange | Mango | Grapes | |
| P | 120 | 50 | 160 | 150 |
| Q | 90 | 160 | 60 | 90 |
| R | 140 | 120 | 190 | 110 |
| S | 160 | 50 | 40 | 70 |
The total number of students who like grapes from schools P and R together is what percentage of the total number of students who like mango from school R?(Correct to two decimal places)
The following bar graph shows the results of a survey conducted for 200 students about their favourite hobbies.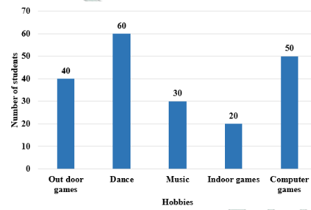
In percentage terms, how many more students chose outdoor games as their favourite hobby over those who chose indoor games as their favourite hobby?
If the circumference of the top of a hemispherical bowl is 44 mm, find the radius of the top of that bowl. \(\text{(Use }\pi = \tfrac{22}{7}\text{)}\)
Find the value of 'b' in the given mathematical statement:
30% of b% of 296 = 40% of 50% of 5% of 1480
\(\frac{80}{3}\)
\(\frac{40}{3}\)
\(\frac{125}{3}\)
\(\frac{50}{3}\)