The volume of a wall whose height is six times its breadth and length is half its height, is 23958 cm3 . What is the breadth of the wall?
The cost price of a wine bottle is ₹660. If the wine bottle is sold at a loss of 20%, what is the nominal amount of loss incurred through its sale?
The pie-chart below shows, in terms of the central angles of the sectors representing each group, the distribution of number of boys in six classes of a school in a village.
Total boys in 6 classes = 1800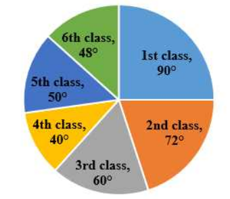
If 40% of the students studying in 3rd class like to play hockey, then the number of students studying in 3rd class who do NOT like to play hockey is: