The pie chart shows the % of students studying in different courses in a college.
The degree measure of angle for students studying in BBA is: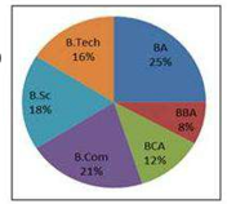
The income of a person first increased by 25% and then decreased by 25%. What % is the new income of the original income?
\(91\tfrac{1}{4}\%\)
\(93\tfrac{3}{4}\%\)
\(95\tfrac{3}{4}\%\)
\(92\tfrac{1}{4}\%\)
P, Q and R can complete a piece of work in 6 days, 12 days and 15 days respectively. P starts working alone on 1st, 4th, 7th ….., Q works alone on 2nd, 5th, 8th,….and R works alone on 3rd, 6th,9th….This pattern is continues till the work is completed. In how much time (in days) is the entire work done?
\(10\tfrac{3}{5}\)
\(9\tfrac{3}{10}\)
\(9\tfrac{1}{2}\)
\(10\tfrac{1}{2}\)
The ratio of cost price to selling price of an article is 186:206. The profit per cent on it is:
\(12\tfrac{50}{93}\)
\(12\tfrac{70}{93}\)
\(10\tfrac{70}{93}\)
\(10\tfrac{50}{93}\)
If A:B = \( \frac{1}{3} \) : \( \frac{1}{5} \) , B:C = \( \frac{1}{7} \):\( \frac{1}{8} \) and C:D=\( \frac{1}{10} \) : \( \frac{1}{21} \) , then A:B:C:D is:
The table below shows the production of transformers by five different companies in the year 2022 from January to June. Study the table carefully and answer the question that follows.
| Month/Company | P | Q | R | S | T |
| January | 145 | 140 | 177 | 163 | 140 |
| February | 178 | 122 | 179 | 188 | 187 |
| March | 185 | 135 | 160 | 130 | 145 |
| April | 150 | 130 | 169 | 148 | 172 |
| May | 146 | 128 | 180 | 137 | 153 |
| June | 128 | 145 | 195 | 148 | 170 |
What is the difference between the total production of companies Q and R from the month January to June?
Kavita bought a table at 30% discount on its original price. She sold it with 48% increase on the price she bought it. What is the percentage difference between the new sale price and original price? If the original price is ₹8,000, then how much extra money did Kavita get as profit?
What sum of money invested at 8% per annum in \(1\tfrac{1}{2}\) years, compounded half yearly, shall become ₹17,576?