Quantitative Aptitude
The demand and production for five businesses V, W, X, Y, and Z are shown in the accompanying chart, which illustrates them using a basic bar graph to provide an answer.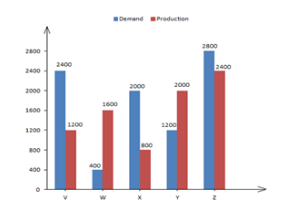
The difference between average demand and average production of the four companies (V, W, X, Y) taken together, is:
What fraction of space will a spherical ball of radius 2.1 cm take in a big spherical container of diameter of 84 cm?
\(\text{(take } \pi = \frac{22}{7}\text{)}\)
\(\frac{1}{400}\)
\(\frac{1}{8000}\)
\(\frac{1}{20}\)
\(\frac{1}{64000}\)
The marks obtained by A in Mathematics, English and Biology are 71 out of 100, 82 out of 150 and 177 out of 200, respectively. What is the average score?
\(\frac{13}{21}\)
\(\frac{11}{16}\)
\(\frac{12}{13}\)
\(\frac{11}{15}\)
The curved surface area of a solid cylinder is 605 cm². The circumference of its base is 22 cm. The total surface area is how many times the height of the cylinder?
\(\text{(TAKE } \pi = \frac{22}{7}\text{)}\)