Quantitative Aptitude
If 40 : 35 :: 35 : x, find the value of x.
\(\frac{49}{16}\)
\(\frac{49}{14}\)
\(\frac{245}{8}\)
\(\frac{49}{8}\)
Study the given graph and answer the question that follows.
The graph shows the data of the number of accidents by three types of vehicles: X, Y and Z in four cities: P, Q, R and S.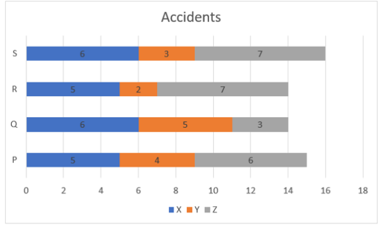
The maximum number of accidents in all cities are due to vehicles of type:
A quadrilateral ABCD has sides AB = 5 units, BC = 12 units, CD = DA and ∠ABC = ∠ADC = 90°.
What is the area of the quadrilateral (in square units)?
The LCM of \(\frac{2}{3}\), \(\frac{5}{6}\), \(\frac{5}{12}\) and \(\frac{7}{18}\) is ?
\(\frac{80}{11}\)
\(\frac{45}{7}\)
\(\frac{70}{3}\)
\(\frac{50}{3}\)