Quantitative Aptitude
Study the given graph and answer the question that follows.
The graph shows the data of production of items: W, R and T by four companies: S, D, F and G as percentage of their total productions.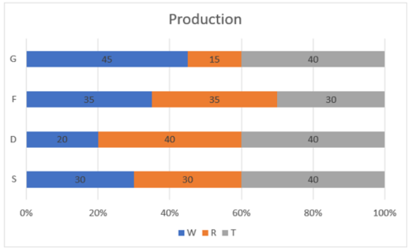
If the total productions of F and S are 2000 and 3000, respectively, the difference in the productions of R by these companies is:
The average age of the 28 boys in a class is 16 years and that of the 26 girls is 15 years. The approximate average age (in years) for the whole class is:
Calculate the simple interest on ₹36,000 at \(8\tfrac{1}{3}\%\)% per annum for a period of 7 months.
The radius of a circle is equal to the side of a square. The perimeters of the square and circle are in the ratio 7 : 11, then the ratio of the areas will be:\(\text{(use } \pi = \frac{22}{7}\text{)}\)
Find the gain %, given that Aditi sold her scooter for Rs.53585 gaining \(\tfrac{1}{5}\)th of the selling price.
Find the cost price of painting (in Rs.) a solid metallic sphere of radius 12cm at the rate of Rs.7 per cm2.\(\text{(use } \pi = \frac{22}{7}\text{)}\)