8.
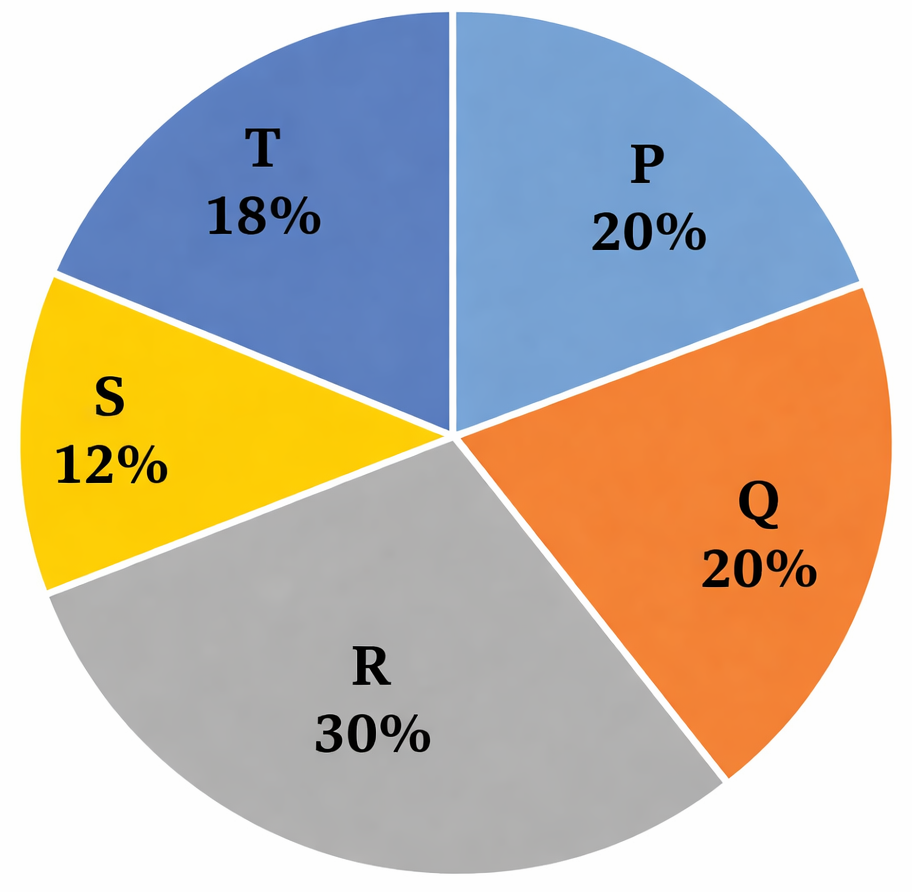
The given pie charts represent the distribution of candidates who enrolled for a bank clerical examination and the candidates (out of those enrolled) who passed the examination. from five different institutes P, Q, R, S and T.
Study the pie charts and answer the question that follows.
(i) Total number of candidates who enrolled for the examination from five institutes = 5500
(ii) Total number of candidates who passed the examination from five institutes = 3300
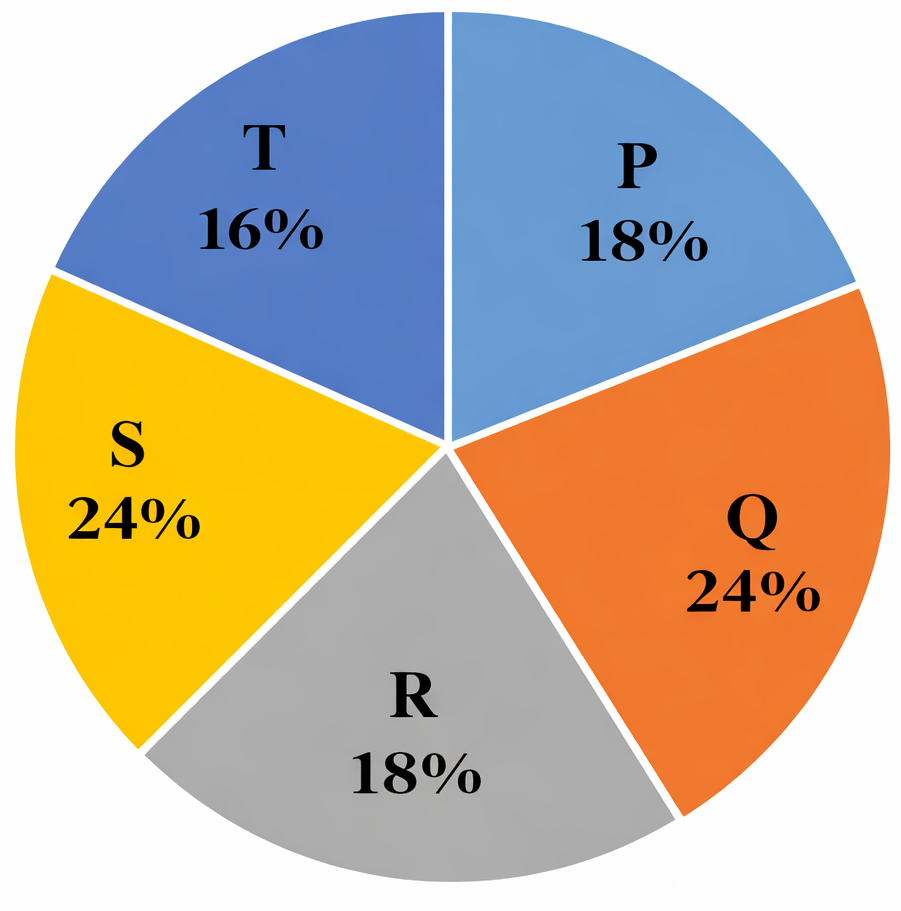
The average number of candidates passed from institutes P and Q together is what percentage of the total number of candidates enrolled from institutes P and Q together?
SSC CHSL 2021-12.04.2021-2