13.
Study the given bar graph and answer the question that follows.
The given bar graph represents the Sales Turnover (in ₹ crore) of five automobile companies A, B. C, D and E during 2014-2015 and 2015-2016. The X-axis represents the Companies, and the Y-axis shows the Sales Turnover (in ₹ crore).
(The data shown here is only for mathematical exercise. They do not represent the actual figures of the company.)
Sales Turnover of Five Automobile Companies (in Rs. crores) during 2014-2015 and 2015-2016
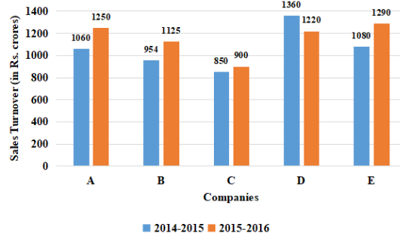
By what percentage is the average sales turnover of all the companies combined in 2015-2016 more than the average sales turnover of the companies A, C and E in 2014-2015 (to the nearest whole number)?
SSC CHSL 2021-13.04.2021-1