The difference between a discount of 25% and two successive discounts of 15% and 20% on a certain bill was ₹28. Find the amount of the bill.
How much simple interest will ₹6,700 earn in 13 months at a 12% interest rate per annum?
If tan 4θ.tan6θ=1, where 6θ is an acute angle, then find the value of cot5θ
Study the given chart and answer the question that follows. The following chart shows the production of textbooks in thousands in the years 2018, 2020 and 2022 from the print houses A, B and C, respectively.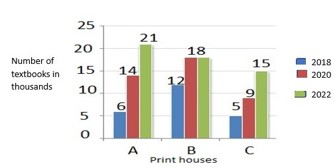
The ratio of textbooks produced by Print house B in the year 2018 to the textbooks produced by Print house C in the year 2020 is ______.
In △ABD and △FEC, ∠BAD = 60°, l(BD) = l(EC), ∠ABD = ∠FEC = 90° and l(AB) = l(FE), Find the ratio of ∠BAD/∠FCE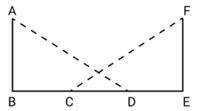
The following pie chart shows the percentage distribution of a total of 1600 employees in different departments of a company. The table shows the ratio of male to female employees in different departments. Study the information and answer the question that follows.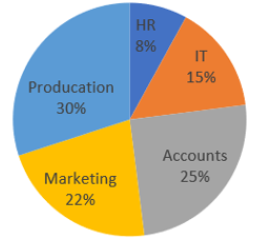
| Departments | Male : Female |
| HR | 3 : 5 |
| IT | 2 : 3 |
| Accounts | 3 : 7 |
| Marketing | 7 : 4 |
| Production | 5 : 3 |
What is the percentage of the number of employees in production department to the number of female employees of all the departments taken together? (correct to one decimal place)