If \(x + \frac{1}{x} = 2\), then find the value of \(\left(x^{2723} + \frac{1}{x^{2356}}\right)\).
Simplify
\(\frac{(7.3)^3 - (4.7)^3}{(7.3)^2 + 7.3 \times 4.7 + (4.7)^2}\)
The following pie chart below shows expenditure in book publishing by a publisher under various heads.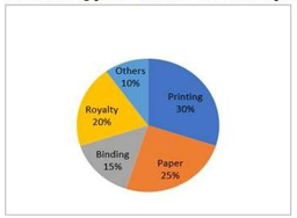
Given that marked price of a book is ₹270,what is the cost of paper to publish a single copy of the book is the marked price of a book is 20% more than its cost price?
The given pie chart shows the amount of money (₹) spent (in degrees) on various sports by a sports academy in a particular year. Study the pie chart and answer the question that follows.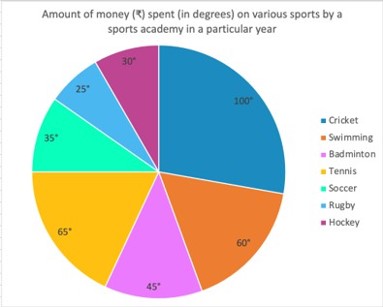
If ₹42,000 were spent on Soccer, then the money spent on Badminton, Tennis and Rugby taken together is what percentage (rounded off to 2 decimal places) more/less than the money spent on Cricket, Swimming and Hockey taken together?
General English
Select the most appropriate option to substitute the underlined segment in the given sentence.
Rohan exercised and ate a lot, lest he should not be weak.
lest he should not weak
lest he would be weak
lest he would not be weak.
lest he should be weak