The bar graph shows the sales of ball pens (in thousand numbers) from six shops S1,S2,S3,S4,S5,S6 during two consequetive years, 2011 and 2012.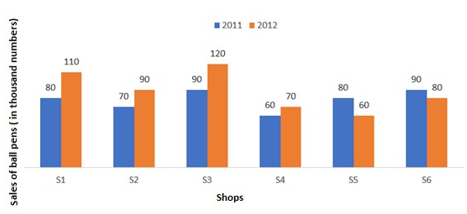
What's the ratio of the total sales of shop S2 for both years to the total sales of shop S5 for both years?
A and B can do a work in 12 days and 16 days, respectively. If they work together for 6 days, then the fraction of the work left is _________.
\(\frac{5}{7}\)
\(\frac{7}{8}\)
\(\frac{1}{8}\)
\(\frac{1}{7}\)
A quadrilateral PQRS is inscribed in a circle of centre O, such that PQ is a diameter and ∠PSR=120°. Find the value of ∠QPR
The base radius of a circular cylinder is 10.5 cm. If the area of its curved surface is 792 cm², then what is the volume of the cylinder?
What is the value of the expression \(\frac{1 - \sin(2t)}{1 + \sin(2t)} \times \frac{\cos(t) + \sin(t)}{\cos(t) - \sin(t)}\)
\(\frac{1 - 2\tan(t)}{1 + 2\tan(t)}\)
\(\frac{1 - \tan(t)}{1 + \tan(t)}\)
\(\frac{1 + 2\tan(t)}{1 - 2\tan(t)}\)
\(\frac{1 + \tan(t)}{1 - \tan(t)}\)
The sum of the ages of 6 children born at the interval of two years each is 90 years. What is the age (in years) of the eldest child?
A sum of ₹1,456, when invested for ten years, amounts to ₹2,366 on maturity. Find the rate of simple interest per annum that was to be paid on the sum invested.
Study the bar graph and answer the questions.
Following bar graph shows the quarterly profit (in lakhs) of a departmental store from 1997-2000.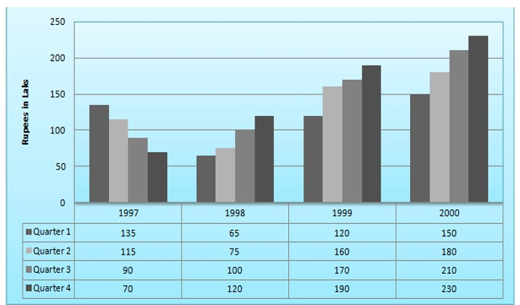
What was the percentage increase in annual profit of the departmental store from 1997-2000?
\(85\frac{33}{41}\%\)
\(84\frac{33}{41}\%\)
\(87\frac{33}{41}\%\)
\(83\frac{33}{41}\%\)
Simplify \(\left[1 - \sin^{2} 32^\circ + \frac{1}{1 + \tan^{2} 58^\circ}\right]\)
The average score of a batsman in twenty matches is 15 and in twenty-five other matches is 24. Find the average score in all the forty-five matches.