Quantitative Aptitude
Simplify
\(6 \times [28 \div 84 \times \{36 \times 49 \div (6 \times 7)\}]\)
The value of θ when \(\sqrt{3}\) cosθ+sinθ=1(1≤θ≤90°) is ?
Study the given bar graph and answer the question that follows.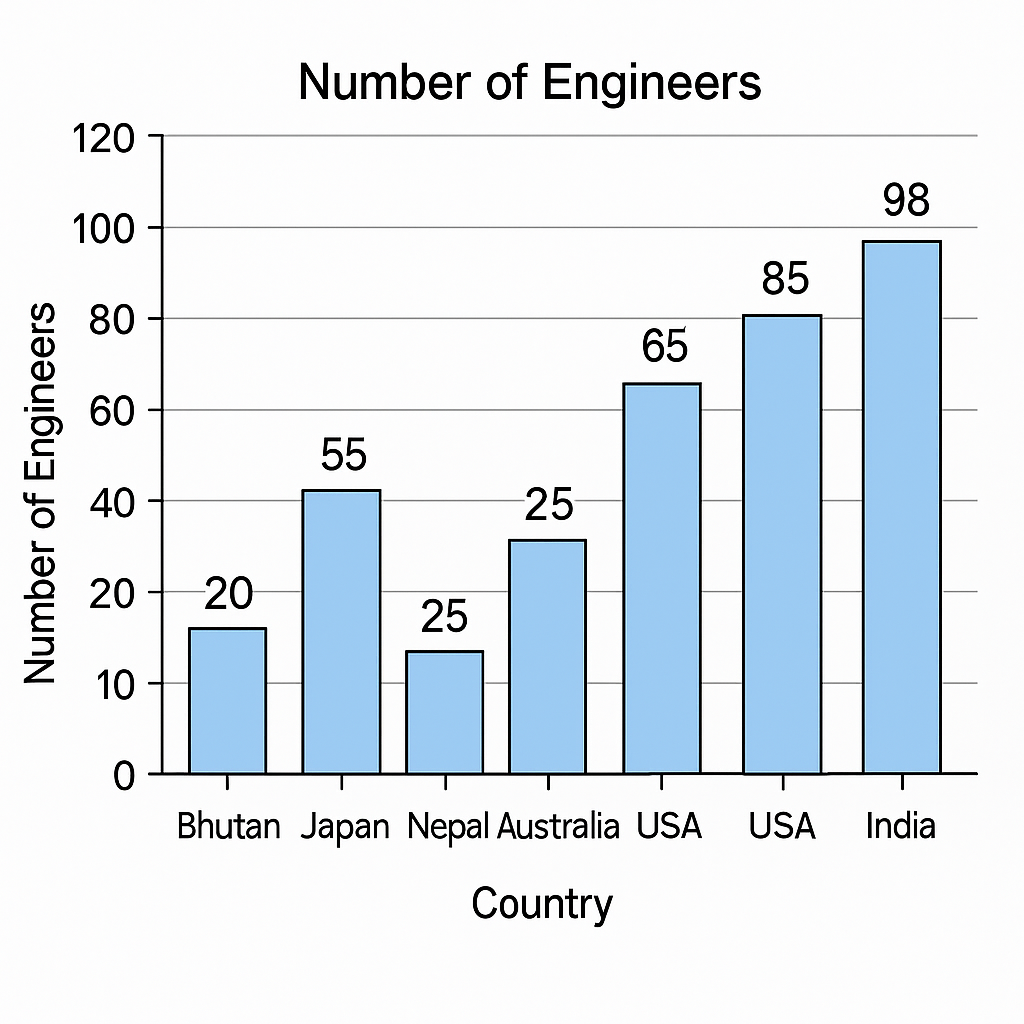
What is the ratio of the number of engineers of countries with an above average to the number of engineers of countries with a below average?
\(\frac{1}{1}\)
\(\frac{39}{71}\)
\(\frac{2}{1}\)
\(\frac{62}{25}\)
Find the length of the longest stick that can be fitted in a cubical vessel of edge 70 cm.
35\(\sqrt{3}\)cm
70\(\sqrt{3}\)cm
10\(\sqrt{3}\)cm
70\(\sqrt{2}\)cm
For what least value of n, 22n+2n is completely divided by 6, where n is an integer?
Study the given bar-graph and answer the question that follows. The bar-graph shows the sales of books (in thousands) from six branches (B1, B2, B3, B4, B5 and B6) of a publishing company during two consecutive years 2000 and 2001.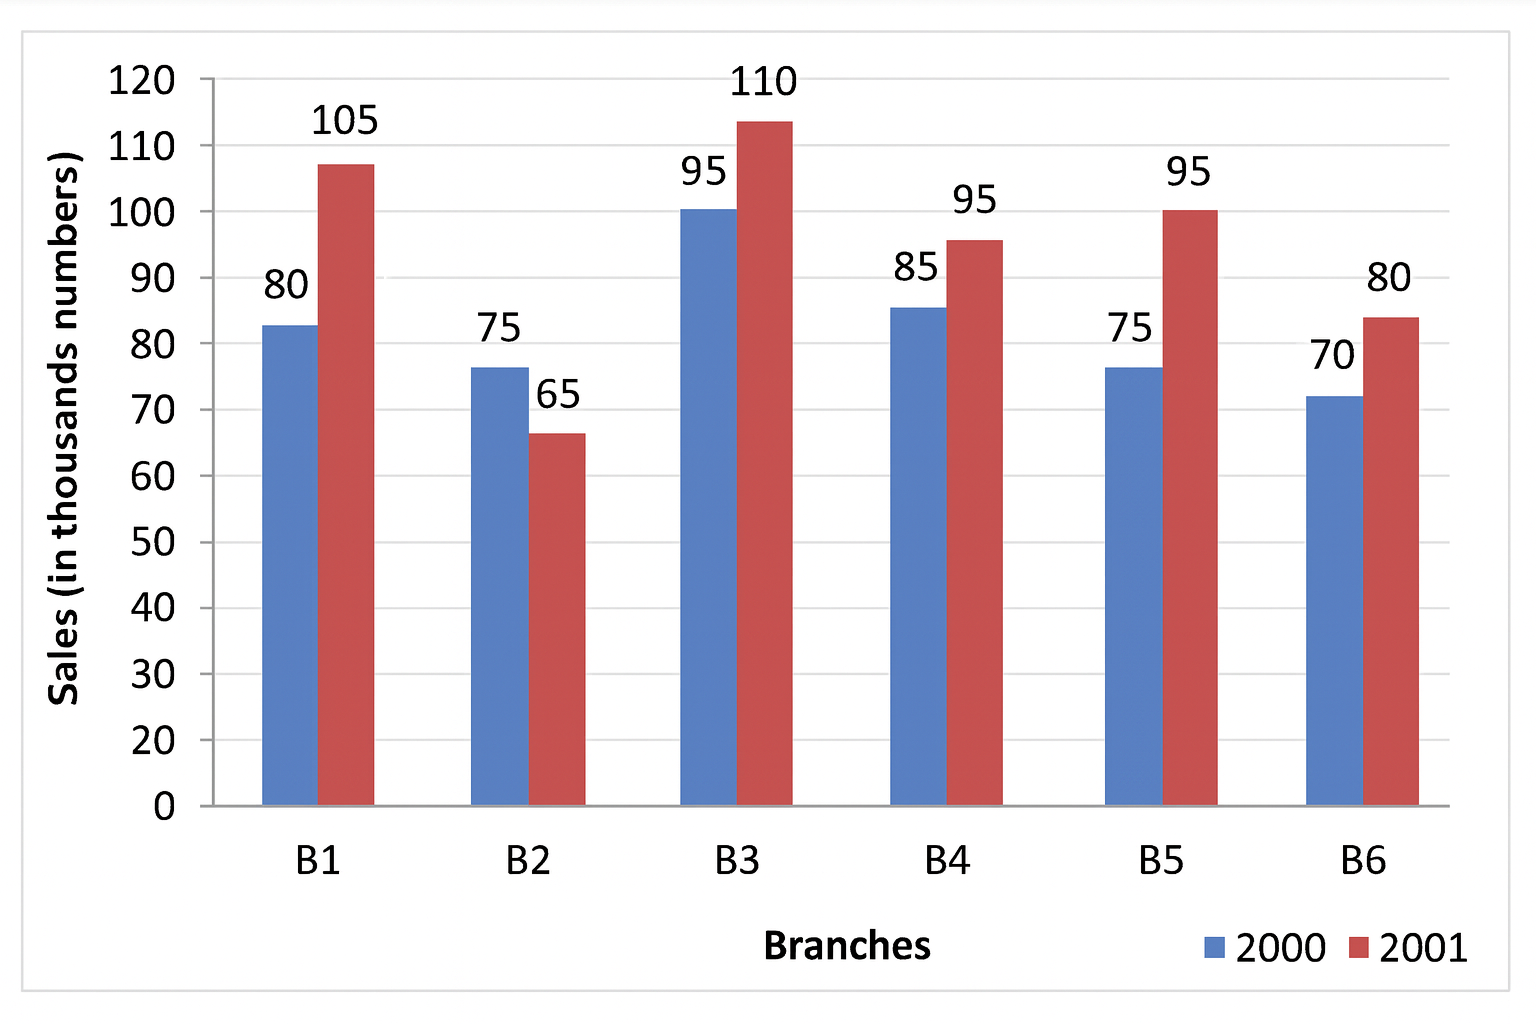
What is the ratio of the total sales of branch B2 for both years to the total sales of branch B4 for both years?