Study the given bar-graph and answer the question that follows.
The bar-graph shows the sales of books (in thousands) from six branches (B1, B2, B3, B4, B5 and B6) of a publishing company during two consecutive years 2000 and 2001.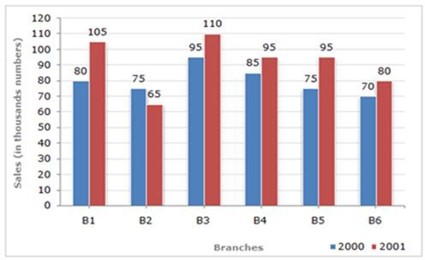
What percentage of the average sales of branches B1, B2 and B3 in 2001 is the average sales of branches B1, B3 and B6 in 2000?
x varies directly with the cube of y, and inversely with the square of z. If x=\(\dfrac{1}{36}\) when y=2 and z=3, then what is the value of 800x when y=3 and z=5?
What is the value of \(\left(\dfrac{5}{\sqrt{3}} - \mathrm{cosec} 60^\circ\right)\)
\(\sqrt{3}\)
\(\dfrac{2}{\sqrt{3}}\)
3\(\sqrt{3}\)
\(\dfrac{1}{\sqrt{3}}\)
If secθ + tanθ = x, then find sinθ.
\(\dfrac{x^2 + 1}{1 - x^2}\)
\(\dfrac{x^2 - 1}{1 + 2x^2}\)
\(\dfrac{x^2 - 1}{1 + x^2}\)
\(\dfrac{1 - x^2}{1 + x^2}\)
General English
Select the most appropriate homophone to fill in the blank.
Ruby gave her mother a hug and offered to knead the ________.