IF 8cotθ=7, then the value of \(\dfrac{1 + \sin\theta}{\cos\theta}\) is ?
\(\dfrac{8 + \sqrt{113}}{7}\)
\(\dfrac{1 + \sqrt{113}}{8}\)
\(\dfrac{7 + \sqrt{113}}{8}\)
\(\dfrac{1 + \sqrt{113}}{7}\)
If x=\(\sqrt{6}\)+2 and y=\(\sqrt{6}\)-2 then what is the value of \(\left(\dfrac{x}{y} + \dfrac{y}{x}\right)^2 - 3\)?
IF 2a-b=3 and 8a3-b3=999, then find the value of 4a2-b2
Study the given bar graph and answer the question that follows.
The following bar graph shows the number of deaths that happened in cities 1,2,3 and 4 in the months mentioned.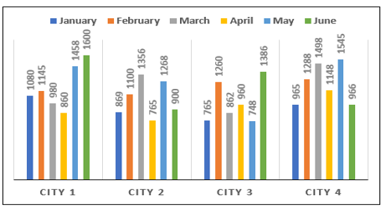
The average number of deaths that occurred during April across all the cities (rounded off to the next integer) is:
If the radius and height of a right circular cylinder are 21cm and 5cm respectively, then the total surface area of the cylinder is ?\(\text{(Use } \pi = \dfrac{22}{7}\text{)}\):
Study the data and answer the question that follows.
| Partners | Percentage of shares |
| Jeevan | 10% |
| Kiran | 15% |
| Lokesh | 8% |
| Rasool | 22% |
| Meera | 45% |
The company has issued 10lakh shares between 5 partners. If Jeevan offers to sell 20,000 of his shares to Meera, how many shares will Meera have?
The table given below shows the distribution of employees in four different companies in 2022.
| Company | Number of zones | Average number of employees per zone | Male : Female |
| A | 30 | 300 | 3 : 5 |
| B | 35 | 400 | 5 : 3 |
| C | 27 | 500 | 4 : 5 |
| D | 25 | 450 | 5 : 4 |
Find the total number of male employees working in company D in 2022.