If the numerator of a fraction is increased by 12% and its denominator is diminished by 8%, then the value of the fraction is \(\frac{56}{69}\). Find the original fraction.
\(\frac{4}{3}\)
\(\frac{3}{2}\)
\(\frac{3}{4}\)
\(\frac{2}{3}\)
The average of two numbers is 13.5 and the square root of their product is \(6\sqrt{5}\). Find the numbers.
The total surface area of a solid hemisphere is 1848 cm2 then its volume (in cm3) is?\(\text{(use } \pi = \frac{22}{7}\text{)}\)
\(5749\frac{1}{3}\)
\(2640\frac{2}{3}\)
\(6473\frac{1}{3}\)
\(3370\frac{1}{3}\)
The bar graph below shows the number of bicycles produced by a company from 1996 to 2000.
Bar Graph showing the the number of bicycles produced by a company from 1996 to 2000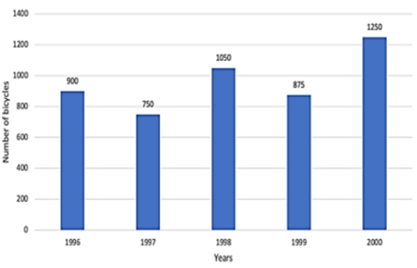
The combined number of bicycles produced between 1998 and 2000 is what percentage (rounded off to one decimal place) of the combined number of bicycles produced in 1996, 1997 and 1999?
Find the simple interest (in ₹) on ₹3,500 as a sum borrowed at 7% per year rate of interest for 4 years.
Study the given table and answer the question that follows.
The table shows the number of candidates who appeared (both male and female) in a Public Examination and the percentage of those who qualified in the examination from two states M and N. A few values are missing in the table (indicated by ------). You will be required to fill them up according to the question.
| Year | State M | State N | ||
| Number of appeared candidates | Percentage of qualified candidates | Number of appeared candidates | Percentage of qualified candidates | |
| 2002 | 540 | 80 | ------ | 60 |
| 2003 | 660 | 70 | ------ | 65 |
| 2004 | -------- | 90 | 850 | 70 |
| 2005 | 550 | 60 | 780 | 95 |
| 2006 | 980 | ------ | 860 | ------ |
If the total number of candidates appeared from State M is 3500 from 2002 to 2006, then what was the number of candidates who qualified from State M in 2004?