The curved surface area of a cylinder is 7920 cm2. IF its base radius is 21 cm, then its height will be ______ ?\(\text{(use } \pi = \frac{22}{7}\text{)}\)
The difference between successive discounts of 28% followed by 25% and 10% followed by 5% on the marked price of a pen is ₹63. The marked price of the pen is:
A cosmetic company provides five different products. The sales of these five products (in lakh) in the years 2006 and 2012 are shown in the following bar graph.
Bar Graph showing the sale the five cosmetic products (in lakh number) manufactured by a company during 2006 and 2012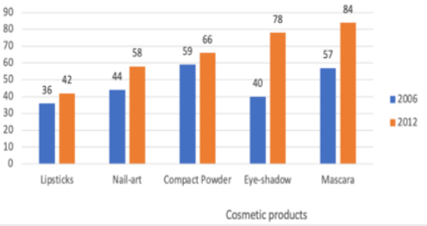
The combined sale of all the five cosmetic products in 2012 increased by what percentage (rounded off to the nearest integer) of the combined sale of all the five cosmetic products in 2006?
The average of 41 numbers is 62. The average of the first 18 numbers is 65.5, and the average of the last 24 numbers is 61.5. If the 18th number from the beginning is excluded, then what is the average of the remaining numbers?
Study the given table and answer the question that follows.
The given table provides information about percentage marks obtained by students of classes X, XI and XII during 2020-2022.
| Year | Percentage Marks | ||
| X | XI | XII | |
| 2020 | 90 | 80 | 94 |
| 2021 | 80 | 85 | 96 |
| 2022 | 70 | 90 | 98 |
What is the difference between the average percentage marks of class X and XII during 2020-2022?