Find the simple interest (in ₹) on ₹2,500 as a sum borrowed at 6% per year rate of interest for 4 years.
The simple interest on a sum is \(\frac{7}{13}\) of the principal for 21 years. What is the rate (in percentage) of interest per annum? (Rounded to two decimal places)
The sale of readymade garments (in million) from four branches of a garment company during 2010 and 2011 is shown in the table below.
| Branch/Year | 2010 | 2011 |
| A1 | 97 | 123 |
| A2 | 105 | 77 |
| A3 | 122 | 148 |
| A4 | 114 | 132 |
The sale of which branch of the garment company (in 2010 and 2011 combined) was the minimum?
Find the simple interest (in ₹) on ₹2,000 as a sum borrowed at 6% per year rate of interest for 6 years.
The given bar graph represents the number of residents living in a society during the past five years. Study the graph carefully and answer the question that follows.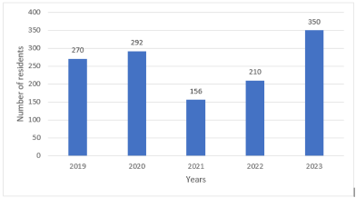
What is the per cent decrement in the number of residents in 2021 as compared to the previous year? (correct up to two decimal places)