The given table shows the production of four types of cars by a company during 2015 – 2019.
| Types |
Years
|
||||
| 2015 | 2016 | 2017 | 2018 | 2019 | |
| A | 90 | 110 | 96 | 114 | 120 |
| B | 94 | 104 | 91 | 118 | 130 |
| C | 86 | 100 | 87 | 104 | 110 |
| D | 70 | 86 | 76 | 94 | 100 |
The difference between the average production of all cars in 2015 and 2019 is equal to:
The following bar graph shows the failure rates per thousand for different electric components: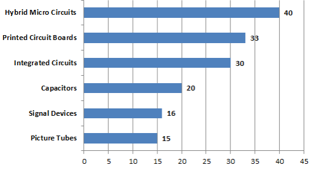
Failure rate of Printed circuit board is what percentage of Capacitors?
Find the simple interest (in ₹) on ₹2,000 as a sum borrowed at 7% per year rate of interest for 5 years.
A car travels at a uniform speed of 45 km/h for 210 km and then travels for 420 km at a uniform speed of 70 km/h. What is the average speed of the car during the entire journey?
\(63 \tfrac{5}{16}\ \text{km/h}\)
\(59 \tfrac{1}{16}\ \text{km/h}\)
\(59 \tfrac{5}{16}\ \text{km/h}\)
\(63 \tfrac{1}{16}\ \text{km/h}\)
A cylindrical tank, 14m in radius, contains water upto the depth of 7m. What is the total area of the wetted surface ?\(\text{(use } \pi = \frac{22}{7}\text{)}\)