
This problem can be solved using the fundamental relationship between the Least Common Multiple (LCM) and the Highest Common Factor (HCF) of two numbers. The product of two numbers is always equal to the product of their LCM and HCF.
D) 42 — By applying the property that the product of two numbers equals the product of their LCM and HCF, we find the other number to be 42.
This is a blood relation puzzle. We need to break down the statement made by Seeta step-by-step to establish the relationships between the individuals mentioned and then determine the final relationship asked in the question.
Correct Option: B) Grandfather
This problem involves finding the largest number that divides a set of numbers, leaving the same remainder in each case. This is a classic application of finding the Highest Common Factor (HCF) or Greatest Common Divisor (GCD).
Since 6 items were left undistributed in each category, the number of items that were actually distributed equally among the children are:
The total number of children must be a common factor of 72, 108, and 135. To find the maximum possible number of children, we need to find the HCF of these three numbers.
Let's find the prime factorization of each number:
The common prime factors are only powers of 3. The lowest power of 3 common to all three factorizations is \(3^2\).
Therefore, HCF \((72, 108, 135) = 3^2 = 9\).
The HCF, 9, represents the largest number of children among whom the books, crayons, and notebooks could be distributed equally after accounting for the remainders.
Correct Option: A) 9
The question asks for the definition of "Vivipara". This is a biological term related to reproduction. We need to identify the correct biological classification or reproductive strategy it refers to.
Correct Option: A) Vertebrates that are born live
Vivipara refers to organisms, particularly vertebrates, that give birth to live young. The embryo develops inside the mother's body, receiving nourishment directly from her, unlike oviparous animals which lay eggs. Most mammals, including humans, are viviparous.
Answer the next 3 questions:
Comprehension:
The bar chart represents percentage marks scored by four students U, V, W and X in History and Geography. Consider the bar chart and answer questions based on it.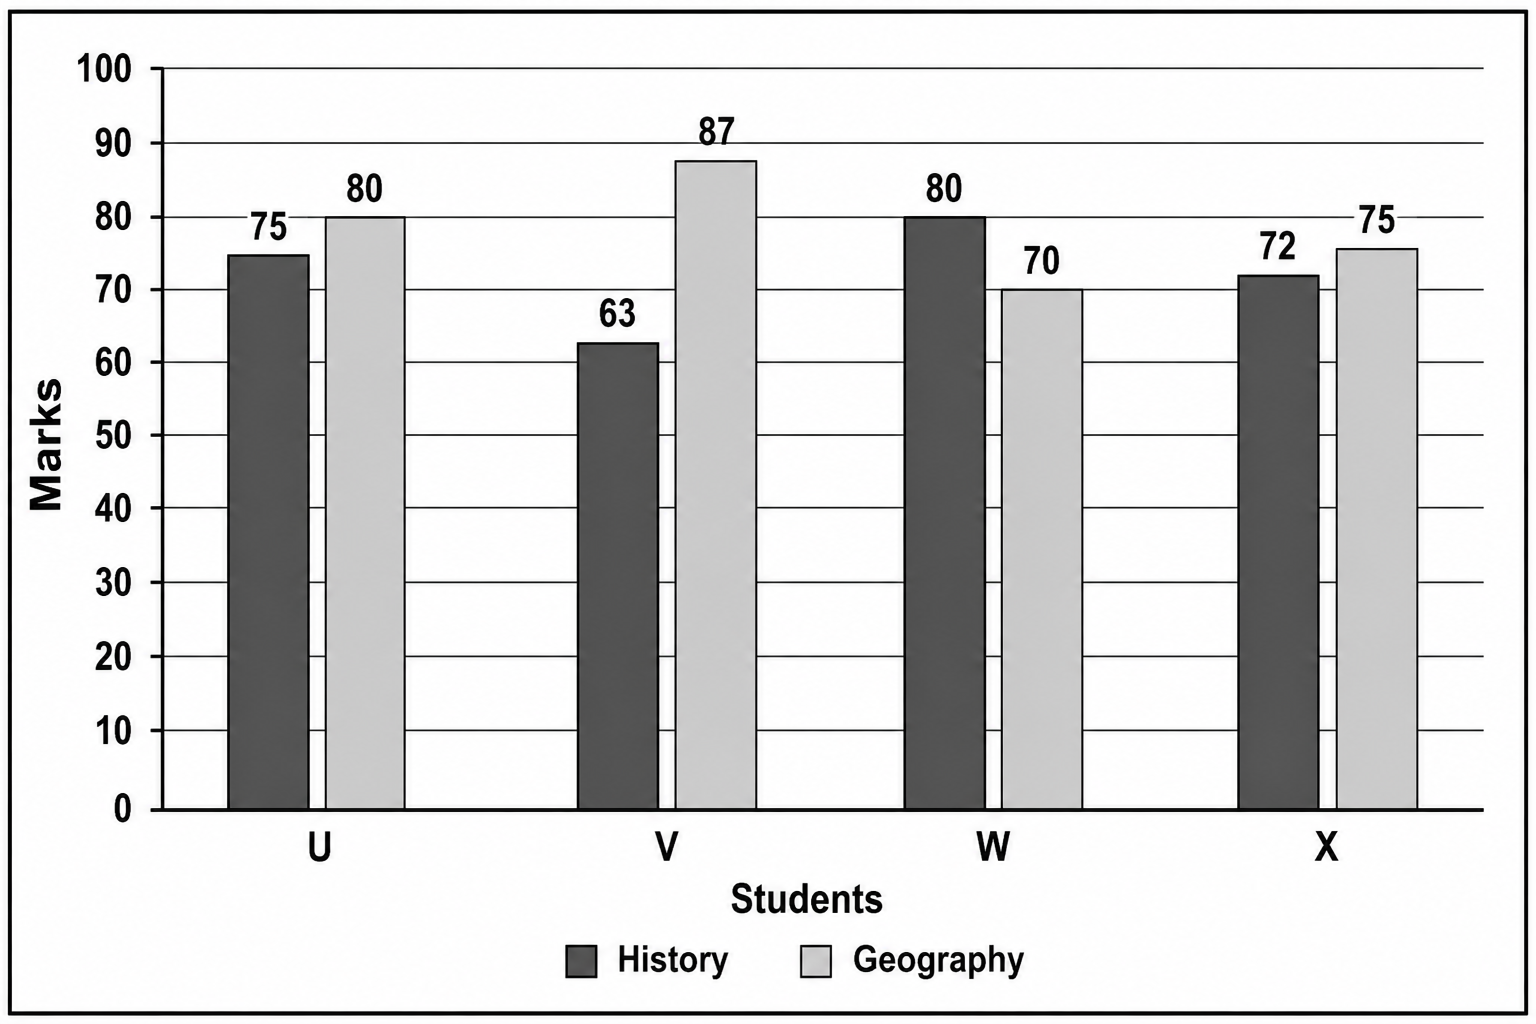
Question 1:
Who scored the highest percentage in both the subjects combined?
To determine who scored the highest percentage in both subjects combined, we must calculate the total marks for each student in History and Geography and compare them.
From the calculations, student U has the highest total marks of 155.
Correct Option: D) U
Question 2:
What is the percentage difference in the total marks obtained in Geography and History?
Question 3:
What is the average percentage marks obtained in History by all students?
To find the average percentage marks obtained in History by all students, we need to sum the marks of all students in History and then divide by the total number of students. The question implies that the marks given are already percentages.
Correct Option: C) 72.5%
If \( a^{x+y} = a^{6} \) and x > y by 2, find x.
The problem provides two pieces of information: an exponential equation and a relationship between two variables, x and y. We need to use these to form a system of linear equations and solve for x.
Analyze the first equation: We are given \( a^{x+y} = a^{6} \). If the bases are equal, then the exponents must be equal. This gives us our first linear equation:
\[ x+y = 6 \quad \text{(Equation 1)} \]Analyze the second piece of information: We are told that x > y by 2. This can be written as:
\[ x = y+2 \quad \text{(Equation 2)} \]Substitute Equation 2 into Equation 1: Substitute the expression for x from Equation 2 into Equation 1:
\[ (y+2) + y = 6 \]Solve for y: Combine like terms and solve for y:
\[ 2y + 2 = 6 \]\[ 2y = 6 - 2 \]\[ 2y = 4 \]\[ y = \frac{4}{2} \]\[ y = 2 \]Solve for x: Now that we have the value of y, substitute it back into Equation 2 to find x:
\[ x = y+2 \]\[ x = 2+2 \]\[ x = 4 \]Thus, the value of x is 4.
Correct Option: D) 4
What is a Limerick?
A Type of Lime Stone
A form of poetry mostly in five lines
A type of Theatre Play
A type of Word game
The question asks for the definition of a "Limerick." This requires knowledge of literary terms, specifically types of poetry. We need to identify the option that correctly describes a Limerick.
B) A form of poetry mostly in five lines
A Limerick is a five-line poem with a strict rhyme scheme (AABBA) and a specific metrical pattern, usually anapestic. They are typically humorous or nonsensical.
This is an analogy question based on word meanings. We need to identify the relationship between the first pair of words (Annual : One year) and apply the same relationship to the second word (Quinquennial) to find its corresponding term.
Correct Option: A) Five years