Rakesh travels the first 320 km by train at a speed of 80 km/hr and the next 250 km by bus at 50 km/hr. Ignoring the buffer time between different modes of travel, the average speed (in km/hr) for his tour was:
The average income of 25 persons is ₹2,400 and that of another 20 persons is ₹1,500. The average income of all of them together is:
\(\text{The LCM of } \tfrac{1}{6},\, \tfrac{4}{15},\, \tfrac{5}{9},\, \tfrac{7}{27},\, \tfrac{8}{3} \text{ is:}\)
\(92\tfrac{1}{3}\)
\(93\tfrac{2}{3}\)
\(93\tfrac{1}{3}\)
\(92\tfrac{2}{3}\)
A shopkeeper normally gives a discount of 40%. To increase his sale before off season, he announces an additional discount of 4% upto a specific date. How much additional discount (in ₹) will a customer get on an item marked for ₹500?
The following graph represents the production of electric scooters (in thousands) for the years 2020 and 2021 from five manufacturers P, Q, R, S, and T.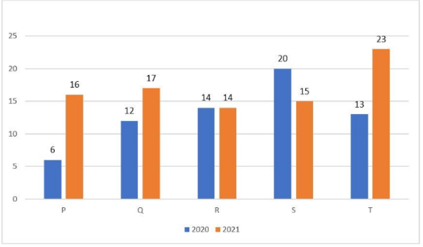
What is the percentage by which the total production of all manufacturers in the year 2021 exceeds the total production of manufacturers in the year 2020? (Round to the nearest integer)
On selling a book for ₹348, a shopkeeper loses 13%. In order to gain 22%, he must sell that book for: