Find the simple interest (in ₹) on ₹3,000 as a sum borrowed at 8% per year rate of interest for 2 years.
The given bar graph shows the imports and exports (in ₹ crores) of steel of a country during the years 2013 to 2017.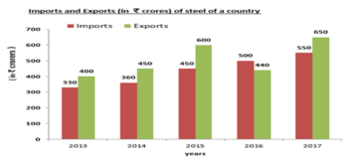
What is the percentage of the total imports for the years 2013, 2015 and 2017 to the exports for all the years taken together (correct to one decimal place)?