
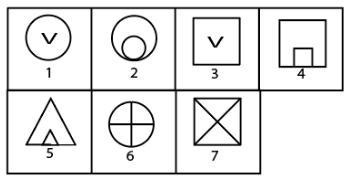
Use each of the following figures only once to form three groups. The three groups thus formed are:
(1,3), (2,5,4), (6,7)
(1,7), (2,5,4), (6,3)
(1,3), (2,6,4), (5,7)
(7,3), (2,5,4), (6,1)
The task is to group the figures based on their visual features. We need to identify patterns or similarities among the figures to form three distinct groups.
Correct Option: A) (1,3), (2,5,4), (6,7)
The question asks to identify the type of chemical reaction that occurs when carbon burns in oxygen to produce carbon dioxide. We need to recall the definitions of different reaction types and match them with the given reaction.
Correct Option: B) Combustion reaction. This reaction involves carbon reacting with oxygen, producing carbon dioxide along with the release of heat and light, which are the defining characteristics of a combustion reaction.
The problem presents a series of letters and asks us to find the missing letter. We need to identify the pattern or rule governing the sequence of letters in the English alphabet.
A) U is the correct answer because it follows the established pattern of adding 3 to the alphabetical position of the preceding letter.
To find the length of each side of the rhombus, we will first use the given area and the length of one diagonal to find the length of the other diagonal. Once both diagonals are known, we can use the property that the diagonals of a rhombus bisect each other at right angles, forming four right-angled triangles. We can then apply the Pythagorean theorem to find the length of a side.
The area of a rhombus is given by the formula:
\[ \text{Area} = \frac{1}{2} \times d_1 \times d_2 \]where \(d_1\) and \(d_2\) are the lengths of the diagonals.
Given:
Substitute the values into the area formula:
\[ 24 = \frac{1}{2} \times 8 \times d_2 \]\[ 24 = 4 \times d_2 \]\[ d_2 = \frac{24}{4} \]\[ d_2 = 6 \text{ m} \]So, the length of the second diagonal is \(6 \text{ m}\).
The diagonals of a rhombus bisect each other at right angles. This means they divide the rhombus into four congruent right-angled triangles. Let the side of the rhombus be \(a\). The legs of these right-angled triangles will be half the lengths of the diagonals.
The side of the rhombus \(a\) is the hypotenuse of these right-angled triangles.
In a right-angled triangle, if the legs are \(x\) and \(y\), and the hypotenuse is \(h\), then \(x^2 + y^2 = h^2\).
Here, \(x = 4 \text{ m}\), \(y = 3 \text{ m}\), and \(h = a\).
\[ a^2 = 4^2 + 3^2 \]\[ a^2 = 16 + 9 \]\[ a^2 = 25 \]\[ a = \sqrt{25} \]\[ a = 5 \text{ m} \]Therefore, the length of each side of the rhombus is \(5 \text{ m}\).
B) 5 m
To determine which of the given numbers is composite, we need to understand the definitions of prime and composite numbers. A prime number is a natural number greater than 1 that has no positive divisors other than 1 and itself. A composite number is a natural number greater than 1 that is not prime, meaning it has at least one divisor other than 1 and itself. We will test each option by checking for factors other than 1 and the number itself.
C) 57 — As determined in Step 3, 57 is divisible by 3 (and 19), making it a composite number.
The question asks to identify the country through which the Magdalena River, one of South America's largest river basins, flows. This requires knowledge of the geography of major South American rivers.
Correct Option: D) Colombia
The Magdalena River is the most important river in Colombia, both historically and economically. It flows entirely within Colombia, from its source in the Andes mountains to its mouth in the Caribbean Sea.
The question asks to identify the catalyst used in the hydrogenation of vegetable oil. Hydrogenation is a chemical process that adds hydrogen atoms to unsaturated compounds, typically in the presence of a catalyst, to make them saturated. Vegetable oils are unsaturated fats, and their hydrogenation converts them into solid or semi-solid fats like margarine.
Correct Option: B) Ni is used as a catalyst in the hydrogenation of vegetable oil. Nickel is a commonly employed transition metal catalyst for this industrial process.
The pie chart represents the annual yield in tons of a certain place. If the yield of sugar is 6000 tons then the yield of wheat will be ______ tons.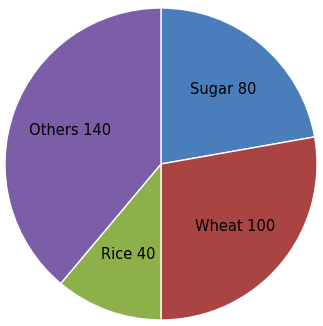
The pie chart shows the distribution of annual yield in tons for different crops. We need to find the yield of wheat given the yield of sugar is 6000 tons.
Correct Option: C) 7500
The mirror image of the above figure is 
To find the mirror image of a given figure, each element of the figure must be reversed horizontally. This means that the leftmost part of the figure becomes the rightmost in the mirror image, and vice versa.
Correct Option: B) IH61QA4RB
To find the smallest natural number that leaves a remainder of 4 when divided by 5, 6, 7, or 8, we first need to find the Least Common Multiple (LCM) of these divisors. The required number will be 4 more than this LCM.
Find the LCM of 5, 6, 7, and 8:
First, express each number as a product of its prime factors:
To find the LCM, take the highest power of all prime factors present in these numbers:
\[ \text{LCM}(5, 6, 7, 8) = 2^3 \times 3 \times 5 \times 7 \]\[ \text{LCM}(5, 6, 7, 8) = 8 \times 3 \times 5 \times 7 \]\[ \text{LCM}(5, 6, 7, 8) = 24 \times 35 \]\[ \text{LCM}(5, 6, 7, 8) = 840 \]Determine the required number:
The problem states that the natural number leaves a remainder of 4 in each case when divided by 5, 6, 7, or 8. This means the number is 4 more than a multiple of their LCM.
The smallest such number will be 4 more than the LCM itself.
\[ \text{Required Number} = \text{LCM}(5, 6, 7, 8) + 4 \]\[ \text{Required Number} = 840 + 4 \]\[ \text{Required Number} = 844 \]Thus, 844 is the smallest natural number that satisfies the given conditions.
B) 844 is the correct answer because it is the smallest number that leaves a remainder of 4 when divided by 5, 6, 7, or 8. This is calculated as \( \text{LCM}(5, 6, 7, 8) + 4 = 840 + 4 = 844 \).
A) 1264 — This number is not the smallest. While it might leave a remainder of 4 when divided by 5, 6, 7, or 8 (e.g., \(1264 = 840 \times 1 + 424\), which is not \(k \times \text{LCM} + 4\)), it is not of the form \(k \times 840 + 4\). For example, \(1264 \div 5\) gives a remainder of 4, \(1264 \div 6\) gives a remainder of 4, \(1264 \div 7\) gives a remainder of 4, \(1264 \div 8\) gives a remainder of 0. So, it does not satisfy the condition for all divisors.
C) 424 — This number is not the smallest. \(424 \div 5 = 84\) remainder \(4\). \(424 \div 6 = 70\) remainder \(4\). \(424 \div 7 = 60\) remainder \(4\). However, \(424 \div 8 = 53\) remainder \(0\). So, it does not satisfy the condition for all divisors.
D) 214 — This number is not the smallest. \(214 \div 5 = 42\) remainder \(4\). \(214 \div 6 = 35\) remainder \(4\). \(214 \div 7 = 30\) remainder \(4\). However, \(214 \div 8 = 26\) remainder \(6\). So, it does not satisfy the condition for all divisors.




