
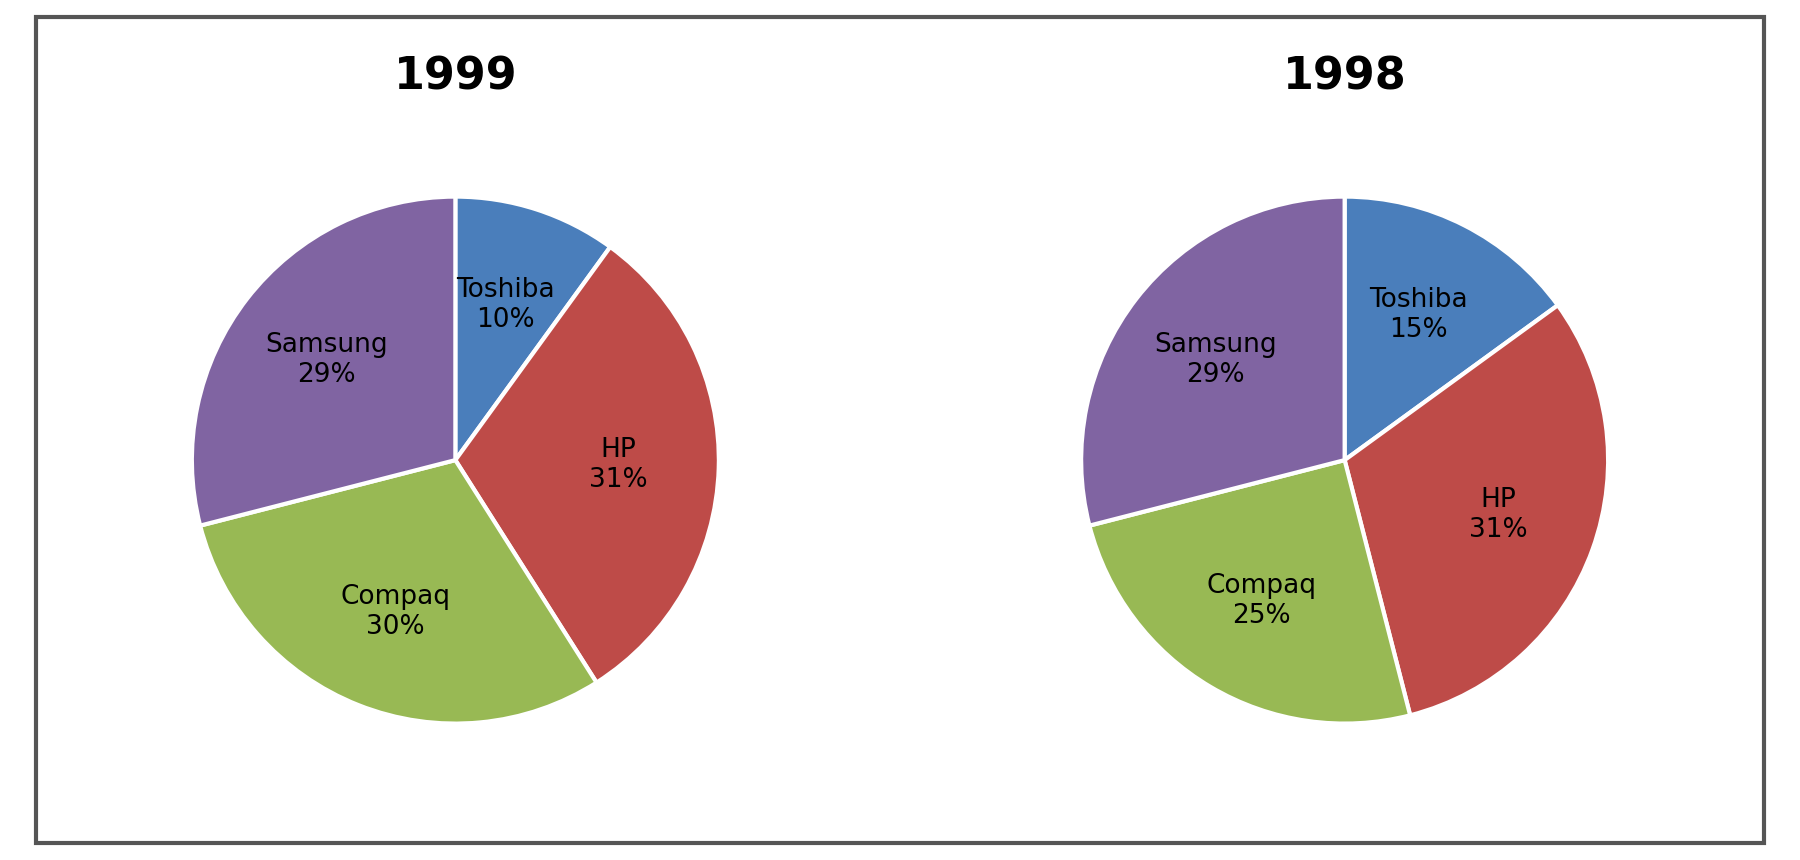
The given chart represents the sales of different companies in the year 1999 and 1998.
If the total sales in 1998 was 7890, which increased by 16.5% in 1999, then the total sales in the year 1999 is approximately ______.
To find the total sales in 1999, we need to calculate the increase from the 1998 sales by the given percentage. The diagrams show the distribution of sales among different companies, but for this calculation, we focus on the total sales figures.
Since we need an approximate value, we round 9191.85 to 9191.
Correct Option: D) 9191
Choose the correct picture which follows: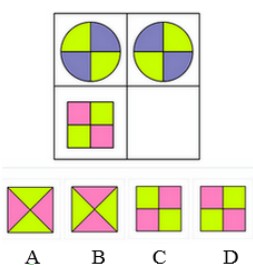
The problem involves identifying patterns and relationships between shapes and colors in the given diagram. The objective is to determine which option logically follows the sequence.
Correct Option: A) Option A correctly follows the alternating color pattern found in the square shape.
To find the number, we need to set up an equation based on the given information. We are told that 30% of an unknown number is equal to 33. We can represent the unknown number with a variable and then solve for it.
C) 110 — As calculated, 30% of 110 is indeed 33.
The question asks to identify the female athlete who is NOT a squash player from the given options. This requires knowledge of prominent Indian female athletes and their respective sports.
Correct Option: A) Koneru Humpy is an Indian chess Grandmaster, not a squash player.
To find the square root of 7056, we can use either the prime factorization method or the long division method. Alternatively, since this is a multiple-choice question, we can test each option by squaring it to see which one yields 7056. A quick estimation can also help narrow down the options.
A) 84 — As calculated, \(84 \times 84 = 7056\). Therefore, the square root of 7056 is 84.
A fraction, when taken away from \( \frac{1}{3} \) gives \( \frac{1}{12} \). The fraction is:
\(\frac{3}{4}\)
\(\frac{1}{4}\)
\(\frac{5}{12}\)
\(\frac{1}{9}\)
The problem asks us to find a fraction that, when subtracted from \( \frac{1}{3} \), results in \( \frac{1}{12} \). We can set up an algebraic equation to represent this relationship and then solve for the unknown fraction.
B) \( \frac{1}{4} \) is the correct fraction, as determined by our calculations.
The problem involves two phases of motion for the rocket: first, moving with constant velocity, and second, moving under gravity as a free body after the fuel supply is cut off. We need to calculate the total height achieved by the rocket. This involves calculating the height covered in the first phase and then the additional height covered in the second phase until its velocity becomes zero.
Calculate the height covered in the first phase:
The rocket travels with a constant velocity for a certain time. The height covered during this phase can be calculated using the formula: \(\text{Distance} = \text{Velocity} \times \text{Time}\).
Determine the initial velocity for the second phase:
When the fuel supply is cut off, the rocket continues to move upward with the velocity it had at that instant. Since the velocity was constant at 20 m/s, this will be the initial upward velocity for the free-body motion.
Calculate the additional height covered in the second phase:
After the fuel is cut off, the rocket moves under gravity. It will continue to move upward until its final velocity becomes zero at the maximum height. We can use the kinematic equation: \(v^2 = u^2 + 2as\), where \(v\) is the final velocity, \(u\) is the initial velocity, \(a\) is the acceleration due to gravity (\(-g\) since it's moving upward), and \(s\) is the displacement (additional height \(h_2\)). Take \(g = 10 \text{ m/s}^2\).
Calculate the total height achieved:
The total height is the sum of the height covered in the first phase and the additional height covered in the second phase.
D) 720 m
The problem is a coding-decoding question where a specific pattern is used to transform a word into a code. We need to identify this pattern by analyzing the given examples and then apply it to the new word.
A) ZZUBDROW is the correct code for BUZZWORD, following the established pattern of reversing the first half and the second half of the word.
The question asks to identify the author of the Indian English novel 'Sita: Warrior of Mithila', published in 2017. This requires knowledge of prominent Indian authors and their works, specifically within the mythological fiction genre.
A) Amish Tripathi is the acclaimed author of 'Sita: Warrior of Mithila'. This novel is part of his popular 'Ram Chandra Series', which retells the epic Ramayana from different perspectives. He is renowned for his contemporary take on Indian mythology.
To find the Highest Common Factor (HCF) of a set of numbers, we can use the prime factorization method. This involves finding the prime factors of each number and then multiplying the common prime factors raised to their lowest powers.
Therefore, the HCF of 20, 28, and 48 is 4.
Correct Option: D) 4