
The question asks for the year in which Mother Teresa was declared a 'Saint' by the Pope. This is a factual question related to a significant historical event in the Catholic Church and a prominent figure. Recalling the specific year of her canonization is key to answering this question.
Correct Option: A) 2016 is the correct year when Mother Teresa was declared a 'Saint' by Pope Francis.
The given pie chart provides details of the percentage distribution of the mode of transport taken by students of a class.
Study the pie chart and answer the question.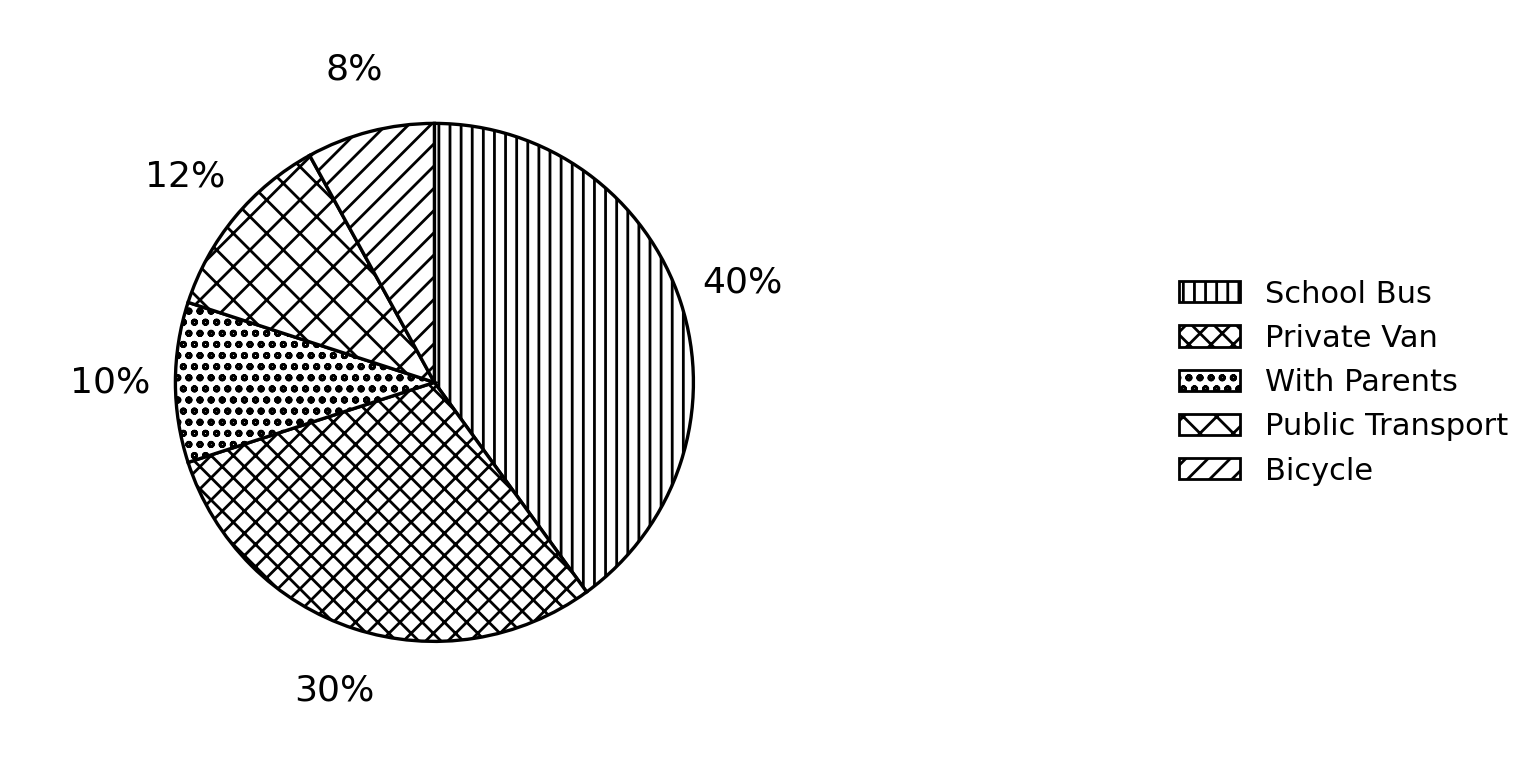
If 140 students use bicycles, what is the total number of students in the class?
To find the total number of students in the class, we need to use the information provided in the pie chart about the percentage of students using bicycles and the actual number of students using bicycles.
Correct Option: C) 1750
The given graph provides the details of the price of petrol (in rupees) per litre in 4 months in Delhi. Study the graph and answer the question.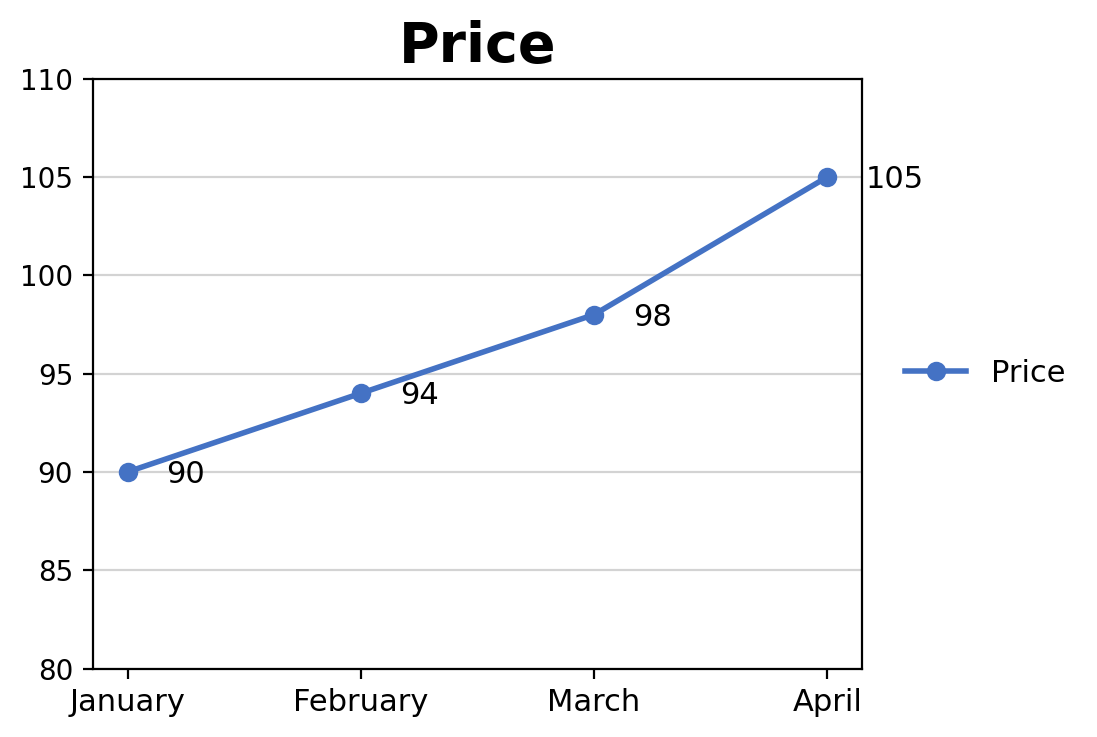
Find the approximate percentage increase of the rate of petrol from January to April.
To find the percentage increase in the price of petrol from January to April, we need to calculate the change in price over the initial price and convert it into a percentage.
Correct Option: C) 17%
This question asks for the standard atomic masses of carbon and hydrogen. This is a fundamental concept in chemistry and physics, often memorized or referenced from the periodic table. The atomic mass unit (u) is used to express these masses.
Correct Option: A) 12 u and 1 u
This option correctly states the atomic mass of carbon as 12 atomic mass units (u) and hydrogen as 1 atomic mass unit (u).
The question asks to identify the institution responsible for credit control in India. This is a fundamental function of a central bank in any economy, aimed at managing the money supply and credit availability.
C) Reserve Bank of India — The Reserve Bank of India (RBI) is the central banking institution of India. It is responsible for controlling, issuing, and maintaining the supply of the Indian rupee. Among its core functions, the RBI formulates and implements monetary policy, which includes various tools for credit control to manage inflation, economic growth, and financial stability.
To find the day of the week on 17 November 2000, given that 13 October 1995 was a Friday, we need to calculate the total number of odd days between these two dates. Odd days are the remainder when the total number of days is divided by 7. Each year contributes 1 odd day, and a leap year contributes 2 odd days. We will calculate odd days for the remaining days in 1995, then for the full years from 1996 to 1999, and finally for the days in 2000 up to 17 November.
Alternatively, we can simplify the calculation of odd days for the full years. From 13 October 1995 to 13 October 2000:
B) Friday. The total number of odd days between 13 October 1995 and 17 November 2000 is 7, which is equivalent to 0 odd days. Therefore, the day of the week remains the same as the starting day, which is Friday.
The question asks for one of the criteria for a political party to be recognized as a National Party in India. This involves understanding the specific conditions laid down by the Election Commission of India (ECI).
C) 6 is the correct answer. A party that secures at least 6 percent of the total votes in Lok Sabha elections or Assembly Elections in four states and wins at least four seats in the Lok Sabha is recognized as a National Party.
The question asks for the location where ISRO conducted the qualification test of the Cryogenic Engine for the Gaganyaan programme on January 12, 2022. This is a factual question related to current events and ISRO's facilities.
The qualification test of the Cryogenic Engine (CE-20) for the Gaganyaan programme was indeed conducted at the ISRO Propulsion Complex (IPRC) in Mahendragiri, Tamil Nadu, on January 12, 2022.
A) Mahendragiri, Tamil Nadu — The ISRO Propulsion Complex (IPRC), where the Cryogenic Engine qualification test for Gaganyaan was successfully conducted, is located in Mahendragiri, Tirunelveli district, Tamil Nadu. This facility specializes in the testing and assembly of liquid propulsion stages and engines.
We are given two conditions: the product of two positive numbers is 500, and the first number is five times the second number. We need to find the sum of these two numbers. We can set up a system of two equations with two variables and solve for the numbers, then find their sum.
Define the variables:
Let the first number be \(x\).
Let the second number be \(y\).
Formulate equations from the given information:
The product of two positive numbers is 500:
\[ x \times y = 500 \quad \text{(Equation 1)} \]The first number is five times the second number:
\[ x = 5y \quad \text{(Equation 2)} \]Substitute Equation 2 into Equation 1:
Replace \(x\) in Equation 1 with \(5y\):
\[ (5y) \times y = 500 \] \[ 5y^2 = 500 \]Solve for \(y\):
Divide both sides by 5:
\[ y^2 = \frac{500}{5} \] \[ y^2 = 100 \]Take the square root of both sides. Since the numbers are positive, we take the positive root:
\[ y = \sqrt{100} \] \[ y = 10 \]Solve for \(x\):
Substitute the value of \(y\) back into Equation 2:
\[ x = 5y \] \[ x = 5 \times 10 \] \[ x = 50 \]Calculate the sum of the two numbers:
Sum \( = x + y \)
\[ \text{Sum} = 50 + 10 \] \[ \text{Sum} = 60 \]Correct Option: A) 60
To determine which metal is less reactive than Aluminium (Al), we need to refer to the reactivity series of metals. The reactivity series lists metals in order of their decreasing reactivity. A metal higher in the series is more reactive than a metal lower in the series.
From the reactivity series:
Therefore, Zinc (Zn) is less reactive than Aluminium (Al).
C) Zn — Zinc (Zn) is positioned below Aluminium (Al) in the reactivity series, indicating that it is less reactive than Al.