
This is a linear arrangement puzzle. We need to deduce the seating order of the six girls (P, Q, R, S, T, U) based on the given clues. All are facing North, which means their left and right correspond to our left and right.
Clue 1: U sits third to the left of R.
This implies there are two people between U and R. Let's represent this as: U _ _ R
Clue 2: U sits second to the left of Q.
This means there is one person between U and Q. So, U _ Q. Combining with the previous clue, we get: U _ Q _ R
Clue 3: S sits third to the right of Q.
From U _ Q _ R, if S is third to the right of Q, then: U _ Q _ R S. This arrangement has 6 positions, which matches the total number of girls. So the arrangement is: U _ Q _ R S.
Clue 4: T is not the immediate neighbour of U.
The current arrangement is U _ Q _ R S. The two empty spots are between U and Q, and between Q and R. Let's fill these. The person between U and Q is not T. The person between Q and R is not T. The only remaining person is P. So, P must be in one of these spots.
Let's re-evaluate the arrangement with the empty slots. The six positions are:
1 2 3 4 5 6
U _ Q _ R SThe empty slots are position 2 and position 4. The remaining girls are P and T.
If T is not an immediate neighbor of U, then T cannot be at position 2. Therefore, T must be at position 4.
This leaves P for position 2.
So the final arrangement is: U P Q T R S
Determine P's position.
Looking at the final arrangement U P Q T R S, P is at the second position from the left end.
A) Second from the extreme left end
Based on our derived arrangement U P Q T R S, P is indeed in the second position from the left end.
The following bar graph shows the production of cotton (in tons) over the years. Study the graph and answer the question.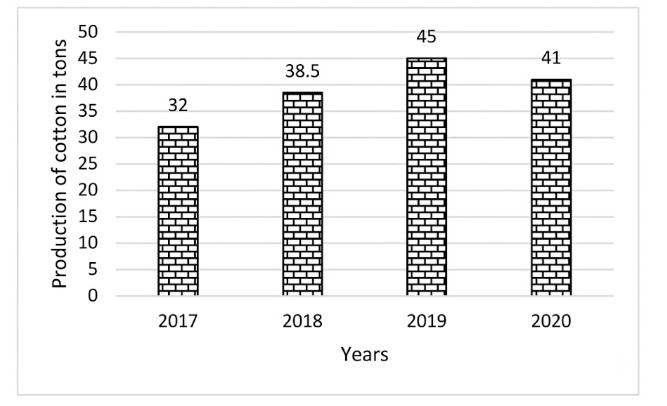
What is the approximate percentage increase in the production of cotton in 2020 as compared to 2017?
To find the percentage increase in cotton production from 2017 to 2020, we need to calculate the difference in production between these years and then express this difference as a percentage of the 2017 production.
Correct Option: C) 28.12%
Which ministry has launched the world’s first multicentre phase III clinical trial to assess Ayurveda’s efficacy in Rheumatoid Arthritis treatment?
Ministry of Ayush
Ministry of Science and Technology
Ministry of Chemicals and Fertilizers
Ministry of Health and Family Welfare
The question asks to identify the ministry responsible for launching a global clinical trial on Ayurveda for Rheumatoid Arthritis. This requires knowledge of the specific roles and responsibilities of different Indian government ministries, particularly those related to traditional medicine and health research.
Correct Option: A) The Ministry of Ayush is responsible for the development, promotion, and research of traditional Indian systems of medicine, including Ayurveda. Therefore, it is the appropriate ministry to launch a clinical trial assessing Ayurveda's efficacy.
The table given below shows the number of students who were interviewed and who got selected by the universities A, B, C and D over the years. Study the table and answer the question.
| Years | Students | |||||||
| A | B | C | D | |||||
| Interviewed | Selected | Interviewed | Selected | Interviewed | Selected | Interviewed | Selected | |
| 2017 | 1500 | 700 | 1200 | 800 | 1800 | 1000 | 1200 | 750 |
| 2018 | 1600 | 800 | 1500 | 600 | 2000 | 1120 | 1400 | 460 |
| 2019 | 2200 | 900 | 2000 | 680 | 1800 | 1100 | 2000 | 500 |
| 2020 | 1500 | 950 | 1600 | 700 | 1800 | 1200 | 1500 | 450 |
| 2021 | 1100 | 400 | 1500 | 490 | 1300 | 800 | 1300 | 350 |
In university C, the total number of students selected over the years was approximately what percentage of the total number of students who were interviewed over the years?
To find the percentage of students selected in university C, we need to calculate the total number of students interviewed and the total number of students selected for university C over all the given years. Then, we will use the percentage formula: \[\frac{\text{Total Selected}}{\text{Total Interviewed}} \times 100\].
Total interviewed in C \( = 1800 + 2000 + 1800 + 1800 + 1300 = 8700 \)
Total selected in C \( = 1000 + 1120 + 1100 + 1200 + 800 = 5220 \)
Correct Option: B) 60 %
Select the set in which the numbers are related in the same way as are the numbers of the following sets.
(NOTE: Operations should be performed on the whole numbers, without breaking down the numbers into constituent digits. E.g. 13 → Operations on 13 such as adding/multiplying etc. to 13 can be performed. Breaking down 13 into 1 and 3 and then performing mathematical operations on 1 and 3 is not allowed.)
(2, 4, 18)
(4, 6, 50)
The problem asks us to identify a set of three numbers that follows the same logical relationship as the given sets: (2, 4, 18) and (4, 6, 50). We need to find a pattern involving the first two numbers that results in the third number.
B) (3, 5, 32)
Here, \(A=3\), \(B=5\).
Using the pattern: \(A^2 + B^2 - 2 = 3^2 + 5^2 - 2 = 9 + 25 - 2 = 34 - 2 = 32\).
This matches the third number in the set (32). Therefore, option B follows the same relationship.
In this question, a group of numbers/symbols is coded using letters as per the table given below and the conditions which follow. The correct combination of codes following the condition is your answer.
| Number/Symbol | 8 | = | 4 | 7 | @ | % | > | 2 | ! | ? | 5 | 3 | < | 9 |
| Code | Z | F | T | J | D | H | E | X | V | W | K | U | P | A |
Conditions:
(i) If the first element is a symbol and the last, a number, the codes for these two are to be interchanged.
(ii) If the first element is an odd number and the last, an even number, the first and last elements are to be coded as Ø.
(iii) If both second and third elements are perfect squares, the third element is to be coded as the code for the second element.
How will 3 = < 2 @ 8 be coded?
The problem requires us to code a given sequence of numbers and symbols based on a provided coding table and a set of conditions. We need to first apply the conditions in the given order and then use the coding table to find the final coded sequence.
C) Ø F P X D Ø is the correct code derived after applying the conditions.
The question asks to identify the youngest Indian badminton player to win a BWF Super 100 tournament in 2022. This requires knowledge of recent achievements in Indian badminton.
Correct Option: B) Unnati Hooda became the youngest ever Indian to win a BWF Super 100 tournament when she clinched the women's singles title at the Odisha Open 2022 at the age of 14.
The question asks to identify the holy book of Muslims that describes the relationship between God and his creations. This requires knowledge of major religious texts and their associated faiths.
The central religious text of Islam, believed by Muslims to be a revelation from God, is the Quran. It details God's nature (omnipotent, omniscient) and His guidance for humanity.
A) Quran: The Quran is indeed the central religious text of Islam, which Muslims believe to be a revelation from God (Allah). It contains the teachings, laws, and narratives that describe the relationship between the omnipotent and omniscient God and His creations, guiding Muslims in all aspects of life.
This problem can be solved using the concept of direct proportionality or by finding the rate of eating oranges. Since Rachna eats at a constant pace, the number of oranges eaten is directly proportional to the time taken.
Alternatively, using direct proportionality:
D) 100 min is the correct answer. It would take Rachna 100 minutes to eat 35 oranges at the same pace.
The question asks for the basic event in reproduction. Reproduction involves creating new individuals, and for this to happen, the genetic material must first be accurately copied and passed on. We need to identify which of the given options directly relates to the accurate transmission of genetic information.
B) Replication of DNA is the basic event in reproduction because it ensures that the genetic material, which carries all hereditary information, is accurately copied and can be passed on to the next generation. This duplication of genetic information is a prerequisite for any form of reproduction, whether it's cell division in asexual reproduction or the formation of gametes in sexual reproduction.