
The question asks for the year in which the British Parliament passed the Regulating Act to control the East India Company. This is a factual question related to Indian history, specifically the constitutional development under British rule. Recall the key acts and their years.
Correct Option: B) 1773. The Regulating Act was passed in 1773. It was the first parliamentary ratification and authorization of the powers of the East India Company. It established a Governor-General of Bengal and a Supreme Court in Calcutta.
The question asks about the number of elements known to Newlands when he proposed his Law of Octaves. This requires recalling a specific historical fact related to the development of the periodic table.
Correct Option: B) When John Newlands proposed his Law of Octaves in 1865, there were 56 known elements. He believed that no more elements would be discovered.
The problem asks us to find the refractive index of a glass prism for a specific wavelength of light. We are given the average wavelength of light in air and the wavelength of one of the colours inside the prism. We can use the relationship between the speed of light, wavelength, and frequency, along with the definition of the refractive index, to solve this problem.
Recall the relationship between the speed of light (\(v\)), frequency (\(f\)), and wavelength (\(\lambda\)):
\[ v = f \lambda \]When light passes from one medium to another, its frequency (\(f\)) remains constant, while its speed (\(v\)) and wavelength (\(\lambda\)) change.
The refractive index (\(n\)) of a medium is defined as the ratio of the speed of light in vacuum (or air, approximately) (\(c\)) to the speed of light in the medium (\(v\)):
\[ n = \frac{c}{v} \]Using the relationship \(v = f \lambda\), we can write the speed of light in air as \(c = f \lambda_{air}\) and the speed of light in the prism as \(v_{prism} = f \lambda_{prism}\). Since the frequency \(f\) is constant, we can substitute these into the refractive index formula:
\[ n = \frac{f \lambda_{air}}{f \lambda_{prism}} = \frac{\lambda_{air}}{\lambda_{prism}} \]From the problem statement, we are given:
Now, substitute these values into the formula for the refractive index:
\[ n = \frac{600 \text{ nm}}{380 \text{ nm}} \]Calculate the value of \(n\):
\[ n = \frac{600}{380} \approx 1.5789 \]Rounding to two decimal places, the refractive index is approximately 1.58.
Correct Option: A) 1.58
The problem involves inequalities and combining given statements to deduce logical conclusions. We need to combine the two given statements into a single chain of inequalities and then evaluate each option against this combined statement.
The given statements are:
From Statement 2, we know that \(M = B\). We can substitute \(M\) with \(B\) in Statement 1, or substitute \(B\) with \(M\) in Statement 2. Let's combine them by linking through \(M\).
From Statement 2, we have \(A > B\) and \(B = M\). So, \(A > M\).
Now, combine this with Statement 1: \(S = M > Z > X\).
We can write the combined inequality as:
\[ A > B = M > Z > X \]B) X < A
A) B < Z
C) Z > A
D) S > A
Study the graph and answer the question that follows. The following bar chart shows the sales volume of Philips bulbs (in thousand) from five different electric shops in a city during two years 2017 and 2018.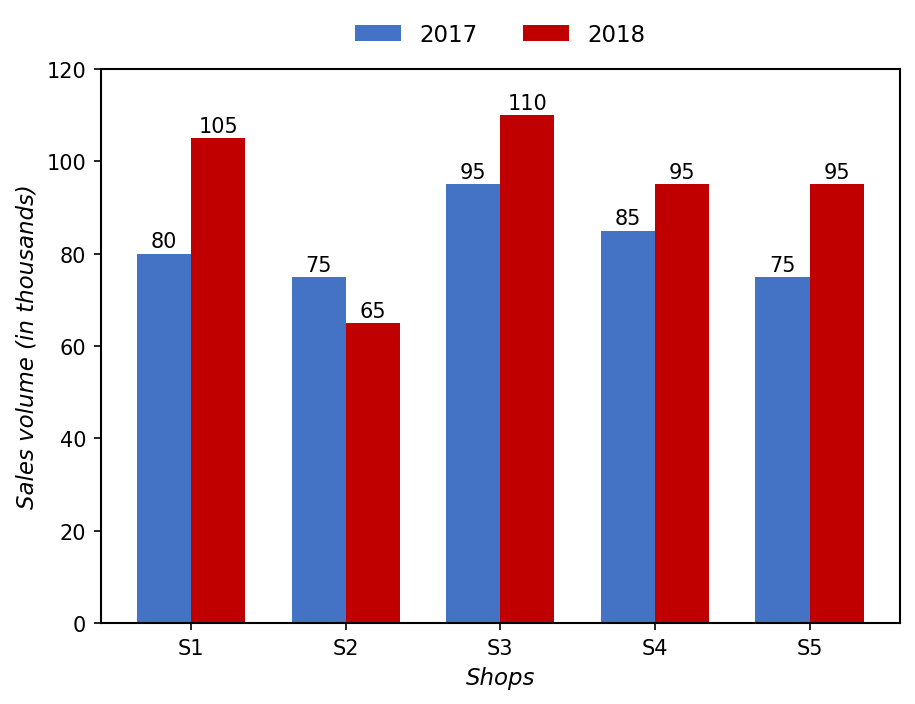
What is the average sales volume of Philips bulbs (in numbers) from all the shops for the year 2017?
To find the average sales volume of Philips bulbs in 2017 from all shops, we need to sum the sales volumes for each shop in 2017 and then divide by the number of shops.
The average sales volume of Philips bulbs from all shops in 2017 is 82,000.
Correct Option: A) 82000
The question asks which option would lead to an increase in the gross fiscal deficit. To answer this, we need to understand the definition of gross fiscal deficit and how its components affect it.
Correct Option: C) Decrease in revenue receipts
If revenue receipts decrease, while total expenditure and non-debt capital receipts remain constant, the gap between total expenditure and total non-borrowing receipts will widen. This directly leads to an increase in the gross fiscal deficit, as the government will need to borrow more to cover its expenses.
Refer to the following number and symbol series and answer the question.
Note: The numbers are to be considered as a whole and should not be split into its constituent digits.
Series:
+ 25 @ 36 # 29 37 % 14 – 7
Question:
How many symbols have a prime number as an immediate neighbour on either of its sides?
To solve this problem, we need to identify all prime numbers present in the given series. Then, for each symbol in the series, we check if both its immediate left and immediate right neighbours are prime numbers. We count how many symbols satisfy this condition.
+ 25 @ 36 # 29 37 % 14 – 7+ 25 @ 36 # 29 37 % 14 – 7A) 3. Based on the interpretation that "on either of its sides" means at least one of the immediate neighbours is a prime number, there are 3 such symbols: '#', '%', and '–'.
The question asks to identify which of the given reactions is NOT a combination reaction. A combination reaction is a type of chemical reaction in which two or more reactants combine to form a single product. The general form is \(A + B \rightarrow AB\).
Slaked lime (\(\text{Ca(OH)}_2\)) is formed when quicklime (\(\text{CaO}\)) reacts with water (\(\text{H}_2\text{O}\)).
\[ \text{CaO(s)} + \text{H}_2\text{O(l)} \rightarrow \text{Ca(OH)}_2\text{(aq)} \]Here, two reactants combine to form a single product. This is a combination reaction.
Water (\(\text{H}_2\text{O}\)) is formed when hydrogen gas (\(\text{H}_2\)) reacts with oxygen gas (\(\text{O}_2\)).
\[ 2\text{H}_2\text{(g)} + \text{O}_2\text{(g)} \rightarrow 2\text{H}_2\text{O(l)} \]Here, two reactants combine to form a single product. This is a combination reaction.
Burning of coal involves the reaction of carbon (\(\text{C}\)) with oxygen (\(\text{O}_2\)) to form carbon dioxide (\(\text{CO}_2\)).
\[ \text{C(s)} + \text{O}_2\text{(g)} \rightarrow \text{CO}_2\text{(g)} \]Here, two reactants combine to form a single product. This is a combination reaction.
When calcium carbonate (\(\text{CaCO}_3\)) is heated, it decomposes into calcium oxide (\(\text{CaO}\)) and carbon dioxide (\(\text{CO}_2\)).
\[ \text{CaCO}_3\text{(s)} \xrightarrow{\text{Heat}} \text{CaO(s)} + \text{CO}_2\text{(g)} \]Here, a single reactant breaks down into two or more products. This is a decomposition reaction, not a combination reaction.
D) Heating of calcium carbonate. This is a decomposition reaction, where a single compound breaks down into two or more simpler substances.
To find pairs of letters in the word DANCER that have as many letters between them as in the English alphabetical order, we need to check both forward and backward directions. We will assign a numerical position to each letter in the alphabet (A=1, B=2, etc.) and then compare the positions of letters in the given word.
C) One — The only pair found is (C, E) where there is one letter (D) between C and E in the alphabet, and there is one letter (E) between C and E in the word DANCER (the letter E itself is not counted as between, but the position of E is such that there is one letter between C and E if we consider the word as C _ E). More precisely, if we consider the letters in the word DANCER as D A N C E R, the pair (C, E) has one letter between them (which is 'E' in the word itself if we count from C to E, but the question asks for letters *between* them, so 'E' is not between C and E. Let's re-evaluate the pair (C, E)).
Let's re-evaluate the definition of "letters between them\
To find the missing number in the series, we need to identify the pattern or relationship between consecutive terms. This often involves looking at the differences between numbers, or differences of differences (second-order differences).
A) 148 is the correct answer because it follows the established pattern of second-order differences increasing by 2 (3, 5, 7, 9, 11).