
The given series is an alternating series where two different patterns are interleaved. We need to identify these two patterns and then apply the relevant pattern to find the missing number.
Let's look at the numbers at odd positions and even positions separately.
1, 7, 13, 19, 25
This is an arithmetic progression with a common difference of \(+6\).
8, 14, 20, 26
This is also an arithmetic progression with a common difference of \(+6\).
The missing number is the 10th term in the original series, which corresponds to an even position. Therefore, we need to apply the pattern for even positions.
The last known even-positioned term is 26 (the 8th term).
The next term in this sequence would be \(26 + 6 = 32\).
D) 32 is the correct answer because the series follows two interleaved arithmetic progressions, both with a common difference of +6. The missing term is the next number in the even-positioned sequence (8, 14, 20, 26, ...), which is \(26 + 6 = 32\).
The question asks to identify the chemical compound commonly known as marble. This requires knowledge of common names for chemical substances, particularly those related to calcium compounds.
Correct Option: C) Calcium carbonate is the chemical compound that constitutes marble. Its chemical formula is \( \text{CaCO}_3 \). Marble is a metamorphic rock largely composed of this mineral.
The mean marks of the following distribution is:
| Marks obtained | No. of students |
| 25 | 5 |
| 30 | 6 |
| 35 | 3 |
| 40 | 1 |
To find the mean marks of a grouped distribution, we use the formula for the arithmetic mean, which is the sum of the product of each mark and its corresponding frequency, divided by the total number of students (total frequency).
| Marks (\(x_i\)) | No. of students (\(f_i\)) |
|---|---|
| 25 | 5 |
| 30 | 6 |
| 35 | 3 |
| 40 | 1 |
\[ \Sigma f_i x_i = 125 + 180 + 105 + 40 = 450 \]
\[ \Sigma f_i = 5 + 6 + 3 + 1 = 15 \]
\[ \bar{x} = \frac{\Sigma f_i x_i}{\Sigma f_i} \]
Substitute the calculated values:
\[ \bar{x} = \frac{450}{15} \]
\[ \bar{x} = 30 \]
The mean marks of the distribution is 30.
Correct Option: D) 30
In this question, a statement is followed by two conclusions. Which of the two conclusions is/are true with respect to the statement?
Statement: E = A < T ≤ D > H > O < X
Conclusions:
I. D > E
II. D > O
Both conclusions I and II are true
Only conclusion II is true
Only conclusion I is true
Neither conclusion I nor II are true
This problem involves analyzing a statement with inequalities and determining the truthfulness of given conclusions. We need to break down the compound inequality into simpler relationships and then check each conclusion against these relationships.
E = A < T ≤ D > H > O < XA) Both conclusions I and II are true — As determined in the step-by-step analysis, both conclusions are derived directly from the given statement.
To find the total power dissipation in a parallel circuit, we can calculate the power dissipated by each lamp individually and then sum them up. Alternatively, we can find the equivalent resistance of the parallel combination and then use the formula for total power. Given that the voltage across each parallel component is the same, calculating individual power dissipations is often simpler.
In a parallel circuit, the voltage across each component is the same as the source voltage.
The formula for power dissipation is \(P = \frac{V^2}{R}\).
The total power dissipated in the circuit is the sum of the power dissipated by each lamp.
\[ P_{\text{total}} = P_A + P_B + P_C \]\[ P_{\text{total}} = 360 \, \text{W} + 180 \, \text{W} + 120 \, \text{W} = 660 \, \text{W} \]Correct Option: B) 660 W
The question asks for the definition of 'Barchans' (Barkhans). This is a direct knowledge-based question related to geographical features, specifically those found in desert environments. The approach is to recall the meaning of the term.
Correct Option: C) Sand dune
The question asks for the city that hosted the National Billiards Championship in December 2021. This is a factual question related to sports events and general knowledge. To answer this, one needs to recall or know the venue of this specific championship.
Correct Option: A) Bhopal
The 88th National Billiards and Snooker Championship was held in Bhopal, Madhya Pradesh, from December 15 to December 26, 2021. This event saw top players from across the country competing in various categories of billiards and snooker.
The question asks about the location of spores in a fern plant. This requires knowledge of the reproductive structures of ferns, which are non-flowering vascular plants.
B) At the underside of leaves. This is the characteristic location where sori, containing sporangia and thus spores, are found in most fern species. The leaves of ferns are often referred to as fronds.
Study the given diagram carefully and answer the question. The numbers in different sections indicate the number of persons. The circle represents ‘sports persons’, the square represents ‘coaches’, and the triangle represents ‘administrators’. How many sports persons are there who are also coaches but NOT administrators?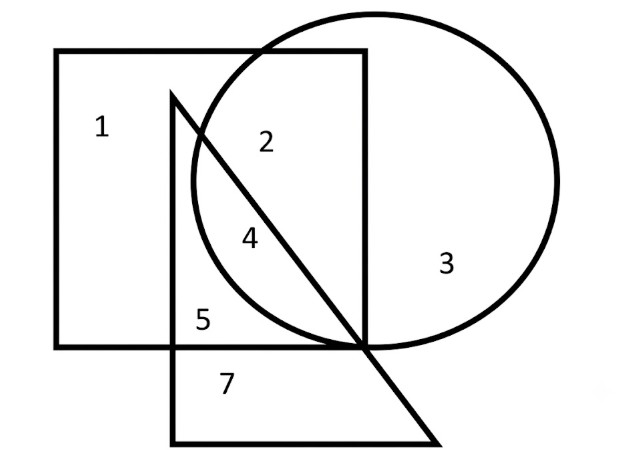
To solve this problem, we need to identify the section of the diagram that represents sports persons who are also coaches but not administrators. Each shape in the diagram represents a different category: the circle for sports persons, the square for coaches, and the triangle for administrators.
In the diagram:
Thus, the number of sports persons who are also coaches but not administrators is 2.
Correct Option: A) 2