
What will come in the place of the question mark (?) in the following equation, if ‘+’ and ‘−’ are interchanged and also ‘×’ and ‘÷’ are interchanged?
28 ÷ 12 + 18 × 6 + 4 =?
The problem requires us to substitute the given operators with their interchanged counterparts and then evaluate the expression using the BODMAS/PEMDAS rule. We need to interchange '+' with '−' and '×' with '÷'.
Identify the original equation:
\[ 28 \div 12 + 18 \times 6 + 4 = ? \]Apply the interchange rules:
Substitute these into the equation:
\[ 28 \times 12 - 18 \div 6 - 4 = ? \]Evaluate the new expression using the BODMAS/PEMDAS rule (Bracket, Orders, Division/Multiplication, Addition/Subtraction):
First, perform multiplication and division from left to right.
Perform multiplication:
\[ 28 \times 12 = 336 \]The expression becomes:
\[ 336 - 18 \div 6 - 4 \]Perform division:
\[ 18 \div 6 = 3 \]The expression becomes:
\[ 336 - 3 - 4 \]Perform subtraction from left to right:
\[ 336 - 3 = 333 \]The expression becomes:
\[ 333 - 4 \]Finally, perform the last subtraction:
\[ 333 - 4 = 329 \]So, the value of the expression is 329.
B) 329 is the correct answer, as derived from the step-by-step evaluation of the modified expression.
The question asks to identify the state where the Solung festival, celebrated by the Adi Tribe on September 1, is most popular. This requires knowledge of the major festivals and tribal communities of India's northeastern states.
The Adi Tribe is one of the major tribal groups inhabiting the Himalayan foothills of Arunachal Pradesh. The Solung festival is an important agricultural festival celebrated by the Adi people. It is a five-day festival celebrated in the first week of September (often starting around September 1) to seek a good harvest and protection from evil spirits.
C) Arunachal Pradesh is the correct answer. The Adi Tribe primarily resides in Arunachal Pradesh, and the Solung festival is their most significant and popular festival, celebrated annually around September 1.
This problem can be solved by setting up a system of linear equations based on the given information about Shalini's age and the sum of her sons' ages at two different points in time (present and six years hence). We will define variables for their current ages and then form equations to solve for Shalini's present age.
Let Shalini's present age be \(S\) years.
Let the sum of the present ages of her two sons be \(X\) years.
From the first statement, "Shalini’s age is four times the sum of the ages of her two sons", we can write the first equation:
\[ S = 4X \quad \text{(Equation 1)} \]Now, consider the situation six years hence (after 6 years):
From the second statement, "Six years hence, her age will be double the sum of their ages", we can write the second equation:
\[ S + 6 = 2(X + 12) \quad \text{(Equation 2)} \]Now we have a system of two linear equations:
Equation 1: \(S = 4X\)
Equation 2: \(S + 6 = 2(X + 12)\)
Substitute Equation 1 into Equation 2 to eliminate \(S\):
\[ (4X) + 6 = 2(X + 12) \]Simplify and solve for \(X\):
\[ 4X + 6 = 2X + 24 \]\[ 4X - 2X = 24 - 6 \]\[ 2X = 18 \]\[ X = \frac{18}{2} \]\[ X = 9 \]So, the sum of the present ages of her two sons is 9 years.
Now, substitute the value of \(X\) back into Equation 1 to find Shalini's present age \(S\):
\[ S = 4X \]\[ S = 4(9) \]\[ S = 36 \]Therefore, Shalini's present age is 36 years.
Correct Option: D) 36 years
The problem involves decoding a pattern in a given code language. We need to identify the rule by which letters are transformed from the original word to the coded word and then apply that rule to the new word.
The pattern for the shift is +3, +4, +5, +6, +7.
The pattern holds true: +3, +4, +5, +6, +7.
So, 'CHAIR' will be written as 'FLFOY'.
Correct Option: A) FLFOY is the correct code for 'CHAIR' based on the identified pattern.
The question asks to identify the specific Article of the Indian Constitution that grants the President the power to declare a 'Proclamation of Emergency'. This requires knowledge of the emergency provisions outlined in the Constitution.
A) Article 352 — This Article explicitly deals with the 'Proclamation of Emergency' (National Emergency) by the President of India. It is invoked in situations of war, external aggression, or armed rebellion.
Study the given pie-chart and answer the following question.
The given pie chart depicts the number of orders placed in four months. The total number of orders placed in the given four months together is 90.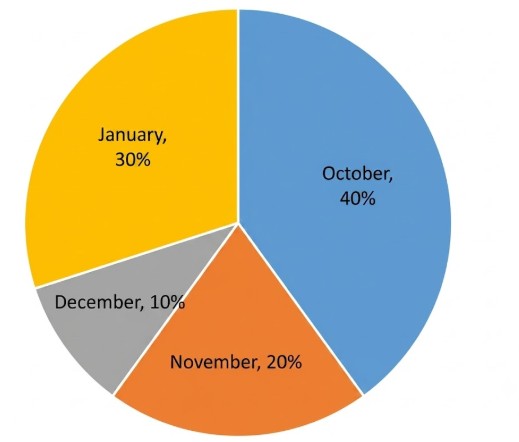
The number of orders placed in February is 24 more than the number of orders placed in November. What is the number of orders placed in February?
The pie chart provides the percentage distribution of orders placed in four months. The total number of orders is given as 90. We need to find the number of orders placed in February, given that February has 24 more orders than November.
Correct Option: B) 42
Study the given line-graph and answer the question that follows. The line graph shows the number of trucks sold (in thousands) by company LMN over the years.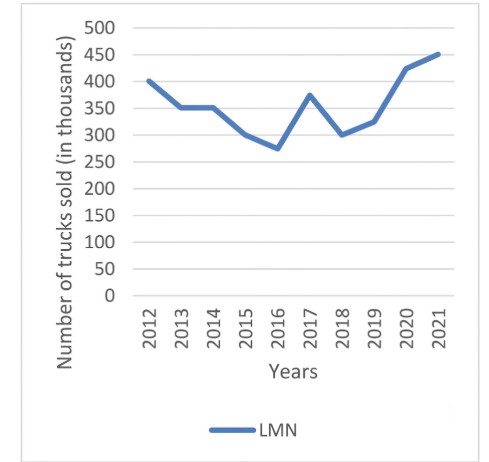
Question: What is the ratio of total trucks sold in 2012, 2013, 2014 and 2015 to trucks sold in 2016, 2017, 2018 and 2020?
To solve this problem, we need to find the total number of trucks sold by company LMN in the specified years and calculate their ratio.
The ratio simplifies to 56:55.
Correct Option: C) 56 : 55
A quadratic equation whose roots are \( \frac{5}{3} \) and −\( \frac{3}{4} \) is:
12x2 - 11x - 15 = 0
6x2 - 11x - 15 = 0
6x2 + 11x - 15 = 0
12x2 + 22x - 15 = 0
To find a quadratic equation given its roots, we can use the relationship between the roots and the coefficients of a quadratic equation. If \(\alpha\) and \(\beta\) are the roots of a quadratic equation, then the equation can be written as \(x^2 - (\alpha + \beta)x + \alpha\beta = 0\).
The given roots are \(\alpha = \frac{5}{3}\) and \(\beta = -\frac{3}{4}\).
Sum of roots, \(\alpha + \beta\):
\[ \alpha + \beta = \frac{5}{3} + \left(-\frac{3}{4}\right) = \frac{5}{3} - \frac{3}{4} \]To add/subtract these fractions, find a common denominator, which is 12:
\[ \alpha + \beta = \frac{5 \times 4}{3 \times 4} - \frac{3 \times 3}{4 \times 3} = \frac{20}{12} - \frac{9}{12} = \frac{20 - 9}{12} = \frac{11}{12} \]Product of roots, \(\alpha\beta\):
\[ \alpha\beta = \left(\frac{5}{3}\right) \times \left(-\frac{3}{4}\right) = -\frac{5 \times 3}{3 \times 4} = -\frac{15}{12} = -\frac{5}{4} \]The general form of a quadratic equation with roots \(\alpha\) and \(\beta\) is \(x^2 - (\alpha + \beta)x + \alpha\beta = 0\).
Substitute the sum and product of the roots into this formula:
\[ x^2 - \left(\frac{11}{12}\right)x + \left(-\frac{5}{4}\right) = 0 \] \[ x^2 - \frac{11}{12}x - \frac{5}{4} = 0 \]To get integer coefficients, multiply the entire equation by the least common multiple (LCM) of the denominators (12 and 4), which is 12:
\[ 12 \left(x^2 - \frac{11}{12}x - \frac{5}{4}\right) = 12 \times 0 \] \[ 12x^2 - 12 \times \frac{11}{12}x - 12 \times \frac{5}{4} = 0 \] \[ 12x^2 - 11x - 3 \times 5 = 0 \] \[ 12x^2 - 11x - 15 = 0 \]Correct Option: A) \(12x^2 - 11x - 15 = 0\)
If p sin²β + q cos²β = r, then the value of cot²β is:
\(\frac{r-q}{r-p}\)
\(\frac{r-p}{r-q}\)
\(\frac{p-r}{r-q}\)
\(\frac{r-q}{p-r}\)
The problem asks us to find the value of \(\cot^2\beta\) given the equation \(p \sin^2\beta + q \cos^2\beta = r\). We will use trigonometric identities to express \(\sin^2\beta\) and \(\cos^2\beta\) in terms of \(\cot^2\beta\) or manipulate the given equation to isolate \(\cot^2\beta\).
Start with the given equation:
\[ p \sin^2\beta + q \cos^2\beta = r \]Divide the entire equation by \(\sin^2\beta\). This is a common technique when dealing with \(\cot\) or \(\tan\) functions, as \(\frac{\cos^2\beta}{\sin^2\beta} = \cot^2\beta\) and \(\frac{1}{\sin^2\beta} = \csc^2\beta\).
\[ \frac{p \sin^2\beta}{\sin^2\beta} + \frac{q \cos^2\beta}{\sin^2\beta} = \frac{r}{\sin^2\beta} \]\[ p + q \cot^2\beta = r \csc^2\beta \]Use the fundamental trigonometric identity \(\csc^2\beta = 1 + \cot^2\beta\) to substitute for \(\csc^2\beta\) in the equation:
\[ p + q \cot^2\beta = r (1 + \cot^2\beta) \]Distribute \(r\) on the right side:
\[ p + q \cot^2\beta = r + r \cot^2\beta \]Rearrange the terms to group \(\cot^2\beta\) terms on one side and constant terms on the other side. Let's move \(r \cot^2\beta\) to the left and \(p\) to the right:
\[ q \cot^2\beta - r \cot^2\beta = r - p \]Factor out \(\cot^2\beta\) from the terms on the left side:
\[ \cot^2\beta (q - r) = r - p \]Finally, solve for \(\cot^2\beta\) by dividing both sides by \((q - r)\):
\[ \cot^2\beta = \frac{r - p}{q - r} \]Alternatively, if we had moved \(q \cot^2\beta\) to the right and \(r\) to the left in step 5:
\[ p - r = r \cot^2\beta - q \cot^2\beta \]\[ p - r = \cot^2\beta (r - q) \]\[ \cot^2\beta = \frac{p - r}{r - q} \]Both expressions are equivalent. Let's check the given options.
Correct Option: C) \(\frac{p-r}{r-q}\)
A concave lens of focal length 30 cm forms an image of an object placed at 60 cm from it. The position and nature of the image formed will be:
−20 cm, virtual and erect
−20 cm, real and erect
20 cm, virtual and erect
20 cm, real and erect
To determine the position and nature of the image formed by a concave lens, we will use the lens formula and the sign convention for lenses. The lens formula relates the focal length (\(f\)), object distance (\(u\)), and image distance (\(v\)).
Identify the given values and sign conventions:
Apply the lens formula:
The lens formula is given by:
Substitute the known values into the formula:
\[ \frac{1}{-30} = \frac{1}{v} - \frac{1}{-60} \]\[ \frac{1}{-30} = \frac{1}{v} + \frac{1}{60} \]Solve for \(v\):
\[ \frac{1}{v} = \frac{1}{-30} - \frac{1}{60} \]\[ \frac{1}{v} = \frac{-2}{60} - \frac{1}{60} \]\[ \frac{1}{v} = \frac{-2 - 1}{60} \]\[ \frac{1}{v} = \frac{-3}{60} \]\[ v = \frac{60}{-3} \]\[ v = -20 \text{ cm} \]Determine the nature of the image:
A) −20 cm, virtual and erect. The calculation shows \(v = -20 \text{ cm}\), and a negative image distance for a concave lens indicates a virtual and erect image.