
The question asks for the year India became a member of the World Trade Organization (WTO). This is a factual question related to international organizations and India's economic history. Recalling the establishment date of the WTO and India's status as a founding member is key to answering this.
B) 1995 - India became a member of the WTO on January 1, 1995, the day the organization was officially established.
The problem presents a letter series with blanks. The goal is to identify the sequence of letters that, when inserted into the blanks, completes the series to form a repeating pattern. We will analyze the given series, count the total number of letters and blanks, and then try to identify a repeating block by testing the options.
Substitute the letters from Option D into the blanks:
Original: LG _ ALL _ FBL _ GF _ LLGF _ L
Substitute: LG F ALL G FBL L GF C LLGF D L
This gives: LGFALLGFBLLGFCLGFDLL
Let's re-examine the series with the correct option. The question asks to place the letters from left to right in the same sequence in the blanks. Let's try to find a pattern by dividing the series into equal parts.
The series is LG _ ALL _ FBL _ GF _ LLGF _ L. The blanks are at positions 3, 7, 11, 15, 19.
If we assume a repeating block of 4 letters, we have 5 such blocks. Let's try to find the pattern.
Consider the pattern 'LGF'. This appears multiple times. Let's try to complete the series with Option D: FGLCD.
L G F A L L G F B L C G F D L L G F L L
Let's re-evaluate the series and the options. The series is LG _ ALL _ FBL _ GF _ LLGF _ L. The blanks are at positions 3, 7, 11, 15, 19.
Let's try to find a repeating block. If we consider a block of 5 letters, we would have 4 such blocks.
Let's try Option D: FGLCD
L G F A L | L G F B L | C G F D L | L G F L L
This doesn't immediately show a clear repeating pattern. Let's re-examine the series and try to find a pattern by observation.
The series has 'L', 'G', 'F' appearing frequently. Notice 'LLGF'.
Let's try to find a repeating block of 4 or 5.
Consider the pattern 'LGF'.
L G _ A L L _ F B L _ G F _ L L G F _ L
Let's try to insert the letters from Option D: FGLCD
L G F A L L G F B L C G F D L L G F L L
Let's look for a repeating sequence. If we group by 5:
LGFAL | LGFBL | CGFDL | LGFLL
This does not show a clear repetition.
Let's try grouping by 4:
LGF A | LLGF B | LCGF D | LLGF L
This also doesn't show a clear repetition.
Let's re-examine the original series and the structure of the options. The options are sequences of 5 letters, which suggests the blanks are filled in order.
Let's try to find the repeating block by filling the blanks with Option D: FGLCD
L G F A L L G F B L C G F D L L G F L L
Let's look for a pattern like LGFX. We have LGFAL, LGFBL, LGFCL, LGFDL, LGFLL. This seems to be the pattern.
The series is: L G _ A L L _ F B L _ G F _ L L G F _ L
Let's assume the repeating block is 'LGFX'.
The series can be seen as: LGFAL | LGFBL | LGFCL | LGFDL | LGFLL
Let's fill the blanks with FGLCD:
Blank 1: F
Blank 2: G
Blank 3: L
Blank 4: C
Blank 5: D
Inserting these into the series:
L G F A L L G F B L L G F C L L G F D L
Now, let's examine the complete series: LGFALLGFBLLGFCL LGFDL
This series has 20 characters. Let's try to divide it into blocks of 4:
L G F A | L L G F | B L L G | F C L L | G F D L
This doesn't seem to repeat.
Let's try blocks of 5:
L G F A L | L G F B L | L G F C L | L G F D L
This is a clear repeating pattern! The pattern is LGFXL, where X changes sequentially (A, B, C, D).
Let's verify the blanks based on this pattern:
Original series: L G _ A L L _ F B L _ G F _ L L G F _ L
Block 1: L G _ A L. Comparing with LGFAL, the first blank is F.
Block 2: L _ F B L. Comparing with LGFBL, the second blank is G.
Block 3: _ G F _ L. Comparing with LGFCL, the third blank is C and the fourth blank is L. (Wait, the option is FGLCD, so the third blank is L, and the fourth blank is C)
Let's re-evaluate the pattern and the blanks based on the option FGLCD.
The sequence of blanks is F, G, L, C, D.
Series: L G F A L L G F B L L G F C L L G F D L
Now, let's group this into blocks of 5:
LGFAL | LGFBL | LGFCL | LGFDL
This is a perfect repeating pattern where the first four letters are LGF and the last letter is L, and the middle letter (the 4th letter of the block) changes sequentially as A, B, C, D.
Let's check the blanks from the original series against this pattern:
Let's restart with the assumption that the repeating block is 5 characters long and the option D is correct.
Series: L G _ A L L _ F B L _ G F _ L L G F _ L
Blanks to fill: F G L C D
Filled series: L G F A L L G
Below bar graph is the representation of the number of boys and girls studying in 5 different colleges in a given year. Study the bar graph and answer the questions.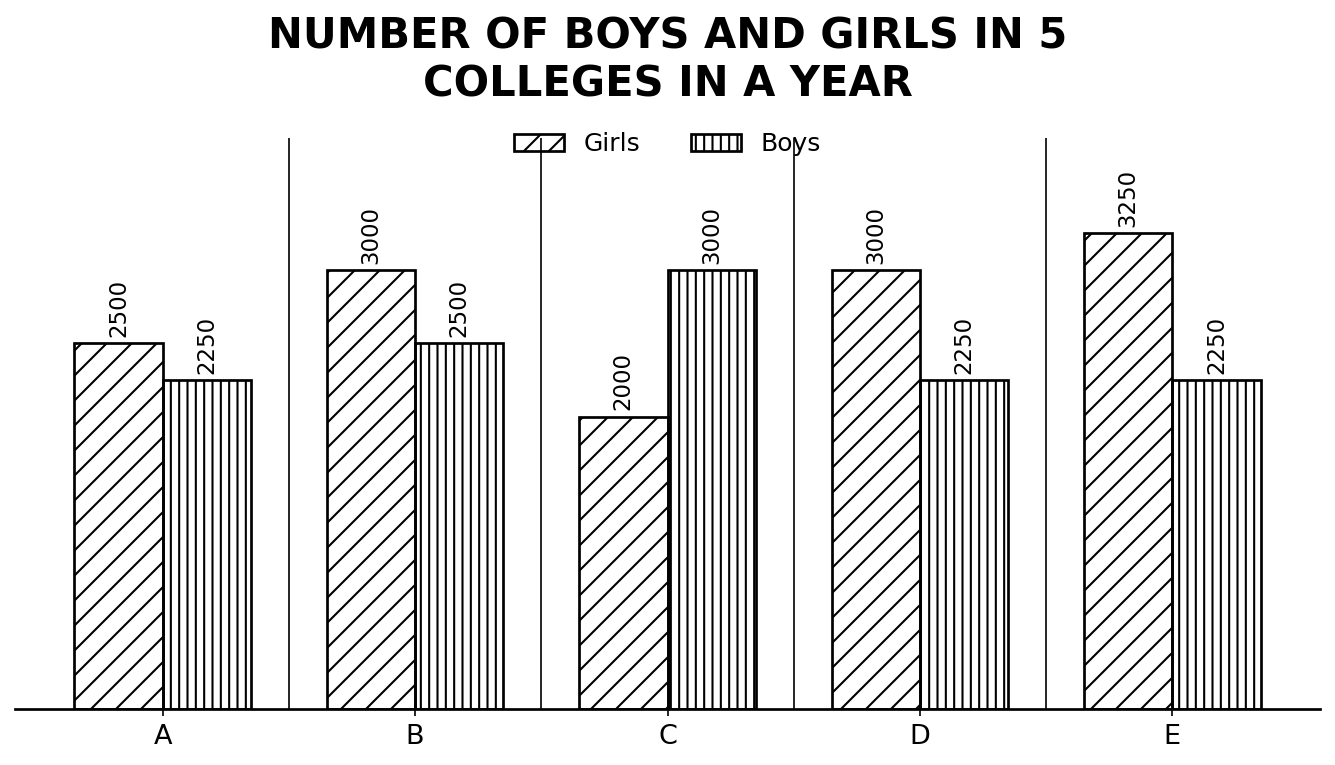
The total number of girls studying in colleges D and E is what percentage of the total number of girls studying in colleges A, B and C?
To find the percentage of the total number of girls in colleges D and E relative to the total number of girls in colleges A, B, and C, we need to calculate the totals for each group and then find the percentage.
\[ \text{Total for D and E} = 3000 + 3250 = 6250 \]
\[ \text{Total for A, B, and C} = 2500 + 3000 + 2000 = 7500 \]
\[ \text{Percentage} = \left( \frac{6250}{7500} \right) \times 100 = 83.33\% \]
Correct Option: A) 83.33%
To determine the value of 'a' in the given 15-digit number such that the number is divisible by 9, we will use the divisibility rule for 9. The divisibility rule states that a number is divisible by 9 if the sum of its digits is divisible by 9.
Correct Option: C) 4
The given series is an alternating series that combines a sequence of natural numbers with a sequence of their squares. We need to identify the pattern and apply it to find the missing term.
Let's write down the given series: 10, 121, 11, 144, 12, 169, 13, 196, 14, ?
Observe the terms at odd positions (1st, 3rd, 5th, etc.): 10, 11, 12, 13, 14. This is a simple arithmetic progression where each term is 1 more than the previous one.
Observe the terms at even positions (2nd, 4th, 6th, etc.): 121, 144, 169, 196.
Let's find the square roots of these even-positioned terms:
Notice that the square roots (11, 12, 13, 14) are also in an arithmetic progression, increasing by 1 each time.
Furthermore, there's a direct relationship between the odd-positioned term and the square root of the subsequent even-positioned term. The odd-positioned term is one less than the square root of the next term. For example:
The last given term is 14, which is at an odd position (9th term). The question mark (?) is at the 10th position, which is an even position.
Following the pattern, the number whose square is at the 10th position should be one more than the 9th term (14). So, the base number for the square is \(14 + 1 = 15\).
Therefore, the missing term will be the square of 15.
\[ 15^2 = 15 \times 15 = 225 \]Correct Option: C) 225
The question asks to identify the program or allocation head that received the largest share of the Union sports budget for the financial year 2022-23. This requires knowledge of the budget allocations made by the Indian government for sports during that specific period.
Correct Option: D) Khelo India
The Khelo India program received the largest allocation of INR 1000 crore in the Union sports budget for the financial year 2022-23, making it the biggest beneficiary.
This problem involves the properties of midpoints of a triangle's sides and the relationship between the area of the original triangle and the triangle formed by connecting these midpoints. We will use the Midpoint Theorem and its corollary regarding areas.
Understand the Midpoint Theorem: The Midpoint Theorem states that the segment connecting the midpoints of two sides of a triangle is parallel to the third side and is half the length of the third side.
Apply the Midpoint Theorem to triangle ABC:
Identify the relationship between triangle PQR and triangle ABC: The triangle PQR, formed by joining the midpoints of the sides of triangle ABC, is similar to triangle ABC. Furthermore, the four triangles formed (PQR, ARQ, BPR, CPQ) are congruent to each other.
Relate the areas: When a triangle is formed by joining the midpoints of the sides of another triangle, the area of the inner triangle (PQR) is one-fourth the area of the original triangle (ABC).
This can be expressed as:
\[ \text{Area}(\triangle PQR) = \frac{1}{4} \text{Area}(\triangle ABC) \]Substitute the given value: We are given that the area of triangle PQR is \(6 \text{ cm}^2\).
\[ 6 \text{ cm}^2 = \frac{1}{4} \text{Area}(\triangle ABC) \]Calculate the area of triangle ABC: Multiply both sides by 4 to find the area of triangle ABC.
\[ \text{Area}(\triangle ABC) = 4 \times 6 \text{ cm}^2 \]\[ \text{Area}(\triangle ABC) = 24 \text{ cm}^2 \]C) 24 cm² is the correct answer. As derived, the area of triangle ABC is four times the area of triangle PQR.
We need to find the count of natural numbers between 18 and 78 (exclusive) that are divisible by 6. This can be solved by identifying the first and last multiples of 6 within the given range and then using the formula for the number of terms in an arithmetic progression, or by simply listing them out.
The sequence of numbers divisible by 6 forms an arithmetic progression with the first term \(a = 24\), the common difference \(d = 6\), and the last term \(l = 72\).
The formula for the \(n\)-th term of an arithmetic progression is \(l = a + (n-1)d\).
Substitute the values:
\[ 72 = 24 + (n-1)6 \]\[ 72 - 24 = (n-1)6 \]\[ 48 = (n-1)6 \]\[ \frac{48}{6} = n-1 \]\[ 8 = n-1 \]\[ n = 8 + 1 \]\[ n = 9 \]Thus, there are 9 natural numbers between 18 and 78 (exclusive) that are divisible by 6.
Correct Option: D) 9
The question asks about the specific function of cilia in the respiratory tract. To answer this, we need to recall the structure and function of the respiratory system, particularly the role of ciliated epithelial cells.
Correct Option: B) Cilia sweep mucus from the lungs and airway towards the nose. This accurately describes the primary function of cilia in the respiratory tract, which is to move the mucus layer containing trapped foreign particles away from the lungs and towards the pharynx, where it can be swallowed or expelled.
The question asks about the structure responsible for supplying nutrients from the mother to the fetus. We need to identify the correct anatomical structure involved in this vital exchange during pregnancy.
Correct Option: D) placenta — The placenta is a temporary organ that develops in the uterus during pregnancy. It provides oxygen and nutrients to the growing baby and removes waste products from the baby's blood. It acts as the primary interface for nutrient and gas exchange between the mother and the fetus.