
Study the given line graph and answer the following question.
The given line graph depicts the number of umbrellas and raincoats sold by shops X, Y and Z.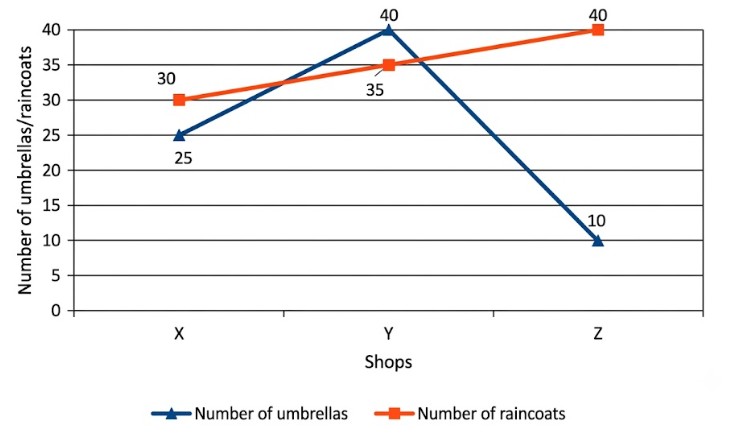
What is the respective ratio between the number of umbrellas sold by shop X and the total number of raincoats sold by shops Y and Z?
To find the respective ratio between the number of umbrellas sold by shop X and the total number of raincoats sold by shops Y and Z, we need to extract the relevant values from the line graph and calculate the ratio.
Correct Option: C) 1 : 3
The question asks for the specific term describing the movement of water molecules across a selectively permeable membrane. This is a fundamental concept in biology, particularly in cell physiology.
A) Osmosis
Osmosis is defined as the net movement of water molecules (or other solvent molecules) across a selectively permeable membrane from a region of higher water concentration (lower solute concentration) to a region of lower water concentration (higher solute concentration). This process is crucial for maintaining cell turgor, water absorption by plants, and kidney function in animals. The question precisely describes this phenomenon.
The given series is an alternating series where numbers are paired. We need to identify the pattern for each pair to find the missing number.
Correct Option: A) 3125
Study the given table and answer the question that follows.
The table shows the total income in Rs and expenditure of five different families under different heads as a percentage of the total income.
| Family | Total Income (in ₹) | Daily Usage | Health Care | Medical | Other Expenses |
| A | 50,000 | 15% | 18% | 10% | 7% |
| B | 65,000 | 20% | 14% | 8% | 8% |
| C | 33,000 | 18% | 20% | 8% | 14% |
| D | 55,000 | 25% | 10% | 11% | 4% |
| E | 90,000 | 30% | 20% | 12% | 8% |
Find the total amount of saving (in ₹) of all the families combined.
Savings = Total Income – Sum of all expenditures
The problem requires calculating the total savings of all five families combined. Savings are defined as Total Income minus the sum of all expenditures. The expenditures are given as percentages of the total income for each family. Therefore, for each family, we first need to calculate the total percentage of expenditure, then the total amount of expenditure, and finally the savings. After finding the savings for each family, we sum them up to get the total savings.
Savings percentage = \(100\% - \text{Total Expenditure Percentage}\)
Savings amount = \[\text{Total Income} \times \frac{\text{Savings Percentage}}{100}\]
B) The total amount of saving of all the families combined is ₹1,25,200.
If the length of a diagonal of a square is 18 cm, then its perimeter (in cm) is ______.
To find the perimeter of a square given its diagonal, we first need to determine the side length of the square. We can use the Pythagorean theorem or the direct formula relating the diagonal and side of a square.
Correct Option: A) \(36\sqrt{2}\)
The question asks to identify the incorrect statement regarding the use of a 2 kW AC appliance with a 250 V AC mains supply. We need to evaluate each option based on standard electrical safety practices and calculations.
Given:
Using the formula \(P = V \times I\), we can find the current \(I\):
\[ I = \frac{P}{V} = \frac{2000 \text{ W}}{250 \text{ V}} = 8 \text{ A} \]D) The appropriate value of fuse to be used is 12 A.
The calculated current drawn by the appliance is 8 A. For safety, a fuse should be rated slightly higher than the normal operating current but not excessively high to prevent it from blowing unnecessarily or failing to protect the circuit in case of a fault. Common fuse ratings available are often 5 A, 10 A, 13 A, 15 A, etc. A 10 A fuse would be appropriate for an 8 A appliance, as it would allow normal operation but blow if the current significantly exceeds 8 A. A 12 A fuse is also a plausible option if available, as it is slightly above 8 A. However, a 13 A fuse is a very common standard rating for appliances drawing around 8-10 A. The statement says "appropriate value of fuse to be used is 12 A". While 12 A is higher than 8 A, it's not the most common or ideal choice. More importantly, if we consider standard fuse ratings, a 10 A fuse would be the most appropriate choice for an 8 A appliance, as it provides adequate protection without being too sensitive. A 12 A fuse might be considered too high for an 8 A appliance, as it would allow a significant overload (up to 50% more than normal operating current) before blowing, potentially risking the appliance or wiring. Therefore, stating 12 A as the *appropriate* value is questionable, making this option the most likely incorrect statement in the context of optimal safety and standard practice. A fuse should be chosen such that it is just above the normal operating current. A 10 A fuse would be more appropriate than a 12 A fuse for an 8 A appliance.
ABCD is a quadrilateral and E, F, G, and H are the mid-points of \(\overline{AB}\), \(\overline{BC}\), \(\overline{CD}\), and \(\overline{DA}\) respectively. The quadrilateral EFGH is necessarily a:
Parallelogram
Square
Rhombus, but not a square
Rectangle, but not a square
This problem can be solved using the Midpoint Theorem, which states that the line segment connecting the midpoints of two sides of a triangle is parallel to the third side and is half the length of the third side. We will apply this theorem to the triangles formed by the diagonals of the quadrilateral ABCD.
In \(\triangle ABC\), E is the midpoint of AB and F is the midpoint of BC. By the Midpoint Theorem:
\[ EF \parallel AC \quad \text{and} \quad EF = \frac{1}{2} AC \]In \(\triangle ADC\), H is the midpoint of DA and G is the midpoint of CD. By the Midpoint Theorem:
\[ HG \parallel AC \quad \text{and} \quad HG = \frac{1}{2} AC \]From steps 1 and 2, we have \(EF \parallel AC\) and \(HG \parallel AC\). This implies \(EF \parallel HG\). Also, \(EF = \frac{1}{2} AC\) and \(HG = \frac{1}{2} AC\), which means \(EF = HG\).
In \(\triangle ABD\), E is the midpoint of AB and H is the midpoint of DA. By the Midpoint Theorem:
\[ EH \parallel BD \quad \text{and} \quad EH = \frac{1}{2} BD \]In \(\triangle BCD\), F is the midpoint of BC and G is the midpoint of CD. By the Midpoint Theorem:
\[ FG \parallel BD \quad \text{and} \quad FG = \frac{1}{2} BD \]From steps 4 and 5, we have \(EH \parallel BD\) and \(FG \parallel BD\). This implies \(EH \parallel FG\). Also, \(EH = \frac{1}{2} BD\) and \(FG = \frac{1}{2} BD\), which means \(EH = FG\).
From step 3, we have \(EF \parallel HG\) and \(EF = HG\). From step 6, we have \(EH \parallel FG\) and \(EH = FG\). A quadrilateral with both pairs of opposite sides parallel and equal in length is a parallelogram.
Therefore, EFGH is necessarily a parallelogram.
A) Parallelogram. As shown by applying the Midpoint Theorem, the opposite sides of EFGH are parallel and equal, which are the defining properties of a parallelogram.
The 56th National Cross Country Championships 2022 was organised at which place?
The question asks for the venue of the 56th National Cross Country Championships 2022. This is a factual question related to sports events in India. To answer correctly, one needs to recall the specific location where this event was held.
Correct Option: B) Kohima was the host city for the 56th National Cross Country Championships in 2022. This event was historically significant for Nagaland as it was the first time the state hosted a national athletics championship.
This problem involves the properties of tangents to a circle. We know that the radius drawn to the point of tangency is perpendicular to the tangent. This forms a right-angled triangle, allowing us to use the Pythagorean theorem to find the unknown distance.
Let C be the center of the circle and T be the point where the tangent from external point P touches the circle. We are given the length of the tangent PT = 24 cm.
The radius of the circle, CT, is given as 10 cm.
According to a fundamental property of circles, the radius drawn to the point of tangency is perpendicular to the tangent. Therefore, the angle \(\angle CTP\) is a right angle (\(90^\circ\)).
This means that \(\triangle CTP\) is a right-angled triangle with the hypotenuse being CP (the distance of P from the center C).
We can apply the Pythagorean theorem, which states that in a right-angled triangle, the square of the hypotenuse is equal to the sum of the squares of the other two sides.
Applying the theorem to \(\triangle CTP\):
\[ CP^2 = CT^2 + PT^2 \]Substitute the given values:
\[ CP^2 = (10 \text{ cm})^2 + (24 \text{ cm})^2 \]\[ CP^2 = 100 \text{ cm}^2 + 576 \text{ cm}^2 \]\[ CP^2 = 676 \text{ cm}^2 \]To find CP, take the square root of both sides:
\[ CP = \sqrt{676 \text{ cm}^2} \]\[ CP = 26 \text{ cm} \]Thus, the distance of P from the center of the circle is 26 cm.
C) 26 cm is the correct answer, as calculated using the Pythagorean theorem.
A) 22 cm — This would be the result if one incorrectly subtracted the radius from the tangent length or made an arithmetic error in the Pythagorean theorem.
B) 11 cm — This value is too small and does not result from any standard geometric calculation in this context. It might arise from an incorrect division or subtraction.
D) 6 cm — This value is also too small. It might be obtained if one incorrectly subtracted the radius from the tangent length and then divided by some factor, or made a significant calculation error.
Mohit starts from a point X and travels 2 km towards the north and takes a right turn and further travels 1 km. He then turns to the right and travels a distance of 3 km. He then takes a right turn and travels a distance of 1 km, and finally turns to the right again and travels a distance of 1 km.
What is the present location of Mohit with respect to his point of initiation of travel, X? (All turns are 90-degree turns only.)
To solve this direction and distance problem, we will track Mohit's movements step-by-step, noting his displacement in the North-South and East-West directions. We can visualize this by drawing a simple path or by keeping a running total of his net displacement from the starting point X.
A) Point X itself. After tracking all movements, Mohit's net displacement from his starting point X is 0 km in both North-South and East-West directions, meaning he has returned to his starting point.