
The question asks for the specific year in which Lakhimi Baruah received the Padma Shri award for her contributions to social work. This requires knowledge of the Padma Awards recipients and the years they were honored.
Correct Option: A) 2021 — Lakhimi Baruah was indeed awarded the Padma Shri for social work in the year 2021. She was recognized for her pioneering work in microfinance and women's empowerment in Assam.
The following is a cumulative frequency distribution (less than type) of 900 persons, each of age 30 years and above.
| Age below (in years) | 40 | 50 | 60 | 70 | 80 |
| Number of persons | 120 | 250 | 650 | 850 | 900 |
What is the modal age (in years) (correct to one decimal place)?
To find the modal age from a cumulative frequency distribution (less than type), we first need to convert it into a simple frequency distribution. Then, we identify the modal class (the class with the highest frequency). Finally, we use the formula for calculating the mode of grouped data.
Convert Cumulative Frequency to Simple Frequency Distribution:
Given cumulative frequency (less than type):
We can form class intervals and their frequencies:
Identify the Modal Class:
The class with the highest frequency is 50-60, with a frequency of 400. So, the modal class is 50-60.
Apply the Mode Formula for Grouped Data:
The formula for mode is:
\[ \text{Mode} = L + \left( \frac{f_1 - f_0}{2f_1 - f_0 - f_2} \right) \times h \]Where:
Substitute the values into the formula:
\[ \text{Mode} = 50 + \left( \frac{400 - 130}{2 \times 400 - 130 - 200} \right) \times 10 \]\[ \text{Mode} = 50 + \left( \frac{270}{800 - 130 - 200} \right) \times 10 \]\[ \text{Mode} = 50 + \left( \frac{270}{470} \right) \times 10 \]\[ \text{Mode} = 50 + \frac{2700}{470} \]\[ \text{Mode} = 50 + 5.7446... \]\[ \text{Mode} \approx 55.7446... \]Round to one decimal place:
Modal age \(\approx 55.7\) years.
C) 55.7 is the calculated modal age when rounded to one decimal place.
The problem involves resistors connected in series. In a series circuit, the current is the same through all components, and the total resistance is the sum of individual resistances. Ohm's Law (V = IR) will be used to find the total voltage.
A) 40 V is the correct answer. This is derived by first finding the total resistance of the series circuit and then applying Ohm's Law with the given current.
Study the given Venn diagram carefully and answer the question that follows. The numbers in different sections indicate the number of persons who consume a certain type of breakfast.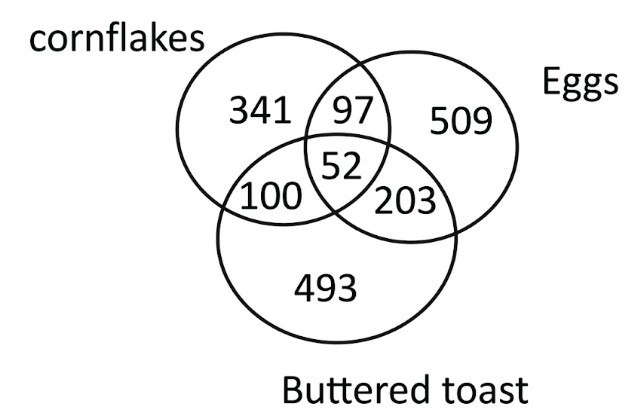
How many such persons are there, who consume both cornflakes and buttered toast?
To find the number of persons who consume both cornflakes and buttered toast, we need to identify the section of the Venn diagram that represents the intersection of these two sets.
Correct Option: B) 100
To simplify the given algebraic expression, we need to first distribute the \(-2\) into the second parenthesis and then combine like terms. This involves applying the distributive property and then rearranging terms in descending order of their exponents.
\(x^2 + 3x + 12 - 2(x^3 - x + 4)\)
Multiply \(-2\) by each term inside the parenthesis \((x^3 - x + 4)\).
\[ -2(x^3) = -2x^3 \]\[ -2(-x) = +2x \]\[ -2(4) = -8 \]Now, substitute these back into the original expression:
\(x^2 + 3x + 12 - 2x^3 + 2x - 8\)
Group terms with the same variable and exponent, and constant terms together.
\(-2x^3 + x^2 + 5x + 4\)
This can also be written as:
\(4 + 5x + x^2 - 2x^3\)
Correct Option: D) \(4 + 5x + x^2 - 2x^3\)
The problem presents a numerical analogy where we need to find the missing term. We must identify the relationship between the first and second terms, and the fifth and sixth terms, and then apply the same logic to find the third term's corresponding value.
Observe the numbers 12 and 20. We can express them as products of consecutive integers or squares.
Alternatively, we can see that \(20 = 12 + 8\). However, this additive relationship might not hold for other pairs.
Let's consider the pattern of consecutive integers. If the first number is \(n \times (n+1)\), then the second number is \((n+1) \times (n+2)\).
For \(12\): \(n \times (n+1) = 3 \times 4\), so \(n=3\). The next term would be \((3+1) \times (3+2) = 4 \times 5 = 20\). This pattern holds for the first pair.
Now, let's apply the same pattern to the numbers 56 and 72.
Here, if the first number is \(n \times (n+1)\), then \(n \times (n+1) = 7 \times 8\), so \(n=7\). The next term would be \((7+1) \times (7+2) = 8 \times 9 = 72\). This pattern also holds for the third pair.
We need to find the number that follows 30 based on this pattern.
Here, if \(n \times (n+1) = 5 \times 6\), then \(n=5\). The missing term should be \((n+1) \times (n+2) = (5+1) \times (5+2) = 6 \times 7 = 42\).
A) 42 — The pattern identified is that if the first number is \(n \times (n+1)\), the second number is \((n+1) \times (n+2)\). Applying this to 30 (\(5 \times 6\)), the next term is \(6 \times 7 = 42\).
Study the given table and answer the following question.
| Distance travelled (in km) by | ||
| Train A | Train B | |
| Day 1 | 362 | 480 |
| Day 2 | 282 | 596 |
| Day 3 | 421 | 640 |
What was the average of the distance travelled (in km) by Train A on the given three days?
To find the average distance travelled by Train A over three days, we need to sum the distances travelled by Train A on each of the three days and then divide by the number of days, which is 3.
Correct Option: D) 355
The question asks to identify the correct statement regarding striated muscles. Striated muscles, also known as skeletal muscles, have distinct characteristics in terms of their cell structure and appearance. We need to evaluate each option based on these known characteristics.
Considering the options, the presence of prominent light and dark bands is the most distinguishing and defining feature of striated muscles.
Correct Option: B) Prominent light and dark bands are present.
The question asks about the natural habitat where mangroves thrive. To answer this, one needs to recall the characteristic environmental conditions that mangroves are adapted to.
Correct Option: C) Coastal areas are the primary habitat for mangroves. They thrive in saline or brackish water environments along tropical and subtropical coastlines, estuaries, and river deltas, where they are regularly inundated by tides.
This is a logical reasoning problem involving arrangement of people on different floors. We need to deduce the exact floor for each person based on the given clues and then identify who lives immediately above A.
D) F — Based on the step-by-step deduction, F lives on floor 6, and A lives on floor 5. Therefore, F lives immediately above A.