
The following table shows the number of sofa sets sold by four salespersons in three different months. Study the table and answer the question.
| Salespersons | May | June | July |
| Vishal | 125 | 110 | 95 |
| Arunima | 140 | 92 | 75 |
| Kartik | 188 | 114 | 80 |
| Mitali | 125 | 120 | 210 |
What is the percentage contribution of Vishal’s May sale in the total sale of May?
To find the percentage contribution of Vishal's May sale in the total sale of May, we need to first calculate the total number of sofa sets sold by all salespersons in May. Then, we will divide Vishal's May sale by this total and multiply by 100 to get the percentage.
Correct Option: D) 21.6% is the calculated percentage contribution of Vishal's May sale to the total May sale.
The question asks to identify which device operates based on the principle of electromagnetic induction. We need to recall the working principles of each given option.
D) Electric generator — An electric generator explicitly uses the principle of electromagnetic induction to produce electricity by converting mechanical energy into electrical energy through the relative motion between a conductor and a magnetic field, inducing an electric current.
This question tests basic knowledge of chemical notation used in chemical equations. Specifically, it asks about the meaning of the state symbol '(aq)' which is commonly used to indicate the physical state of a substance.
D) The term (aq) stands for 'aqueous', which means the substance is dissolved in water, forming a solution.
Study the diagram and answer the questions that follow. The numbers in different sections indicate the number of persons. How many women are speakers and NOT professors and how many professors are speakers and NOT women?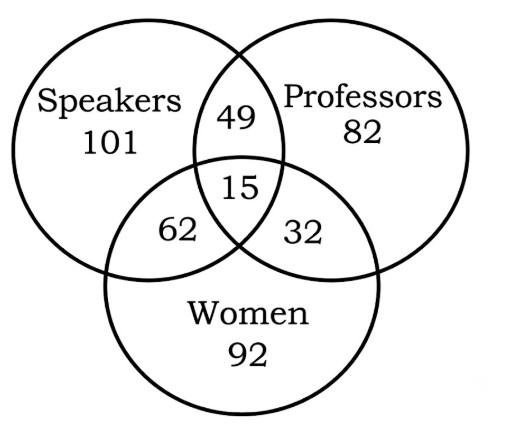
62 and 32, respectively
77 and 49, respectively
47 and 49, respectively
62 and 49, respectively
We need to find two specific groups from the Venn diagram: women who are speakers but not professors, and professors who are speakers but not women.
Correct Option: D) 62 and 49, respectively
This problem involves work and time. We will calculate the one-day work rate for each pair and then sum them up to find the combined one-day work rate of all three individuals. From this, we can deduce the one-day work rate of Madhu, Shiney, and Rosy working together, and finally, the total time they would take to complete the work.
Adding the work rates of all three pairs:
\[ (M + S) + (S + R) + (R + M) = \frac{1}{20} + \frac{1}{12} + \frac{1}{15} \] \[ 2(M + S + R) = \frac{3 + 5 + 4}{60} \quad (\text{LCM of } 20, 12, 15 \text{ is } 60) \] \[ 2(M + S + R) = \frac{12}{60} \] \[ 2(M + S + R) = \frac{1}{5} \]To find the one-day work rate of M, S, and R together, divide the sum by 2:
\[ (M + S + R)\'s \; 1 \; \text{day\'s work} = \frac{1}{5} \times \frac{1}{2} = \frac{1}{10} \]If their combined one-day work is \(\frac{1}{10}\) of the total work, they will complete the entire work in the reciprocal of this fraction.
\[ \text{Time taken} = \frac{1}{\text{Combined 1 day\'s work}} = \frac{1}{1/10} = 10 \; \text{days} \]Correct Option: D) 10 days
The question asks us to identify the correct statement(s) regarding electrical resistance. We need to evaluate each statement based on fundamental principles of electricity.
Correct Option: C) Only C
This problem requires the application of a fundamental algebraic identity related to the sum of cubes. We are given the sum of three variables \((a+b+c)\) and the sum of their products taken two at a time \((ab+bc+ca)\). We need to find the value of \((a^3+b^3+c^3-3abc)\).
Recall the algebraic identity:
\[ a^3 + b^3 + c^3 - 3abc = (a+b+c)(a^2+b^2+c^2 - ab - bc - ca) \]We are given \(a+b+c = 6\) and \(ab+bc+ca = -2\). However, we need the value of \((a^2+b^2+c^2)\).
Use another identity to find \((a^2+b^2+c^2)\):
\[ (a+b+c)^2 = a^2+b^2+c^2 + 2(ab+bc+ca) \]Substitute the given values into this identity:
\[ (6)^2 = a^2+b^2+c^2 + 2(-2) \]\[ 36 = a^2+b^2+c^2 - 4 \]Solve for \((a^2+b^2+c^2)\):
\[ a^2+b^2+c^2 = 36 + 4 \]\[ a^2+b^2+c^2 = 40 \]Now substitute the values of \((a+b+c)\), \((a^2+b^2+c^2)\), and \((ab+bc+ca)\) back into the main identity:
\[ a^3 + b^3 + c^3 - 3abc = (a+b+c)(a^2+b^2+c^2 - (ab+bc+ca)) \]\[ a^3 + b^3 + c^3 - 3abc = (6)(40 - (-2)) \]\[ a^3 + b^3 + c^3 - 3abc = (6)(40 + 2) \]\[ a^3 + b^3 + c^3 - 3abc = (6)(42) \]Calculate the final product:
\[ 6 \times 42 = 252 \]Thus, the value of \(a^3 + b^3 + c^3 - 3abc\) is 252.
D) 252
The question asks to identify the general category of elements that have 2 electrons in their outermost shell. This requires knowledge of electron configurations and the periodic table trends related to different types of elements (metals, non-metals, metalloids, noble gases).
D) metals — Elements with 2 electrons in their outermost shell, excluding Helium, are typically metals. These elements, primarily the alkaline earth metals (Group 2), readily lose these two valence electrons to achieve a stable electron configuration, forming \(+2\) cations. This tendency to lose electrons is a defining characteristic of metals.
To find the roots of a quadratic equation of the form \(ax^2 + bx + c = 0\), we can use either factorization (splitting the middle term) or the quadratic formula. In this case, factorization is a straightforward method.
Identify the coefficients: The given quadratic equation is \(x^2 + 11x - 26 = 0\). Comparing this with the standard form \(ax^2 + bx + c = 0\), we have \(a = 1\), \(b = 11\), and \(c = -26\).
Factorize the equation: We need to find two numbers that multiply to \(a \times c = 1 \times (-26) = -26\) and add up to \(b = 11\).
Split the middle term: Rewrite the middle term \(11x\) using these two numbers:
\[ x^2 + 13x - 2x - 26 = 0 \]Group the terms and factor:
\[ (x^2 + 13x) - (2x + 26) = 0 \]\[ x(x + 13) - 2(x + 13) = 0 \]Factor out the common binomial:
\[ (x + 13)(x - 2) = 0 \]Set each factor to zero to find the roots:
Thus, the roots of the equation are \(-13\) and \(2\).
Correct Option: B) -13 and 2
To solve this problem, we need to calculate the salary after each percentage change. We can assume an initial salary (e.g., 100 units) to make calculations easier. First, we apply the 40% decrease, and then we apply the 50% increase to the new salary. Finally, we compare the final salary with the initial salary to find the percentage loss.
Alternatively, we can use a direct formula for successive percentage changes. If an amount is first decreased by \(x\%\) and then increased by \(y\%\), the net percentage change can be found using the formula:
Net change \( = \left( -x + y - \frac{xy}{100} \right)\% \)
Here, \(x = 40\) (decrease) and \(y = 50\) (increase).
Net change \( = \left( -40 + 50 - \frac{40 \times 50}{100} \right)\% \)
Net change \( = \left( 10 - \frac{2000}{100} \right)\% \)
Net change \( = (10 - 20)\% \)
Net change \( = -10\% \)
A negative sign indicates a percentage loss.
C) 10 % is the correct answer. Rajiv lost 10% of his initial salary.