
The question asks about the year when the Indian Rupee was devalued by the Indira Gandhi government. This requires knowledge of significant economic policy decisions and the political leadership at the time.
Correct Option: D) 1966
The pie chart given below shows the expenditure of a certain company across various sectors – P, Q, R, S, T and U – during a particular year. Study the graph and answer the question.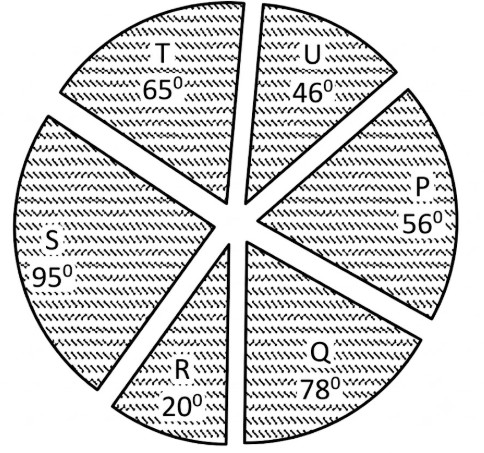
What approximate percentage of the total spending is spent on sector S?
To determine the percentage of total spending on sector S, we will use the angle of sector S in the pie chart and compare it to the total angle of the pie chart, which is 360 degrees.
\[ \text{Percentage for sector S} = \left( \frac{\text{Angle for sector S}}{\text{Total angle}} \right) \times 100 \]
Substitute the values:
\[ \text{Percentage for sector S} = \left( \frac{95}{360} \right) \times 100 \approx 26.39\% \]
Round 26.39% to the nearest tenth, which is approximately 26.4%.
Correct Option: D) 26.4%
To find the missing number in the series, we need to identify the pattern or rule governing the sequence of numbers. We will look for differences between consecutive terms and see if there's a consistent arithmetic or geometric progression, or a pattern in the differences themselves.
Thus, the missing number is 66.
Correct Option: B) 66
Arrange the given fractions in ascending order: \(\frac{1}{3},\ \frac{4}{7},\ \frac{2}{5},\ \frac{5}{6},\ \frac{3}{5}\)
\(\frac{2}{5},\ \frac{1}{3},\ \frac{3}{5},\ \frac{4}{7},\ \frac{5}{6}\)
\(\frac{1}{3},\ \frac{2}{5},\ \frac{3}{5},\ \frac{4}{7},\ \frac{5}{6}\)
\(\frac{5}{6},\ \frac{1}{3},\ \frac{4}{7},\ \frac{2}{5},\ \frac{3}{5}\)
\(\frac{1}{3},\ \frac{2}{5},\ \frac{4}{7},\ \frac{3}{5},\ \frac{5}{6}\)
To arrange fractions in ascending order, we can convert them into decimal form or find a common denominator. Converting to decimal form is often quicker for competitive exams.
\(0.33, 0.57, 0.40, 0.83, 0.60\)
\(0.33, 0.40, 0.57, 0.60, 0.83\)
\[\frac{1}{3}, \frac{2}{5}, \frac{4}{7}, \frac{3}{5}, \frac{5}{6}\]
D) \[\frac{1}{3},\ \frac{2}{5},\ \frac{4}{7},\ \frac{3}{5},\ \frac{5}{6}\]
This order matches our calculated ascending order of the fractions.
The question asks about the difference between the X and Y sex chromosomes in human males, specifically focusing on their physical characteristics like size and gene content. We need to recall basic genetics regarding human sex chromosomes.
B) X chromosome is bigger, whereas Y is smaller. This statement accurately describes the size difference between the X and Y chromosomes. The X chromosome is significantly larger and contains more genetic material than the Y chromosome.
We are given ratios of ages at two different points in time (present and 6 years later) and the ratio of ages at the time of marriage. We need to find how many years ago the marriage took place. We will use a variable to represent the common factor in the ratios and set up equations to find the present ages, then work backward to the marriage date.
Define present ages:
Let the present age of the man be \(7x\) years.
Let the present age of his wife be \(6x\) years.
Ages after 6 years:
After 6 years, the man's age will be \(7x + 6\).
After 6 years, the wife's age will be \(6x + 6\).
Formulate equation from future ratio:
The ratio of their ages after 6 years is given as 8 : 7. So,
Solve for \(x\):
Cross-multiply the equation:
\(7(7x + 6) = 8(6x + 6)\)
\(49x + 42 = 48x + 48\)
\(49x - 48x = 48 - 42\)
\(x = 6\)
Calculate present ages:
Present age of man \(= 7x = 7 \times 6 = 42\) years.
Present age of wife \(= 6x = 6 \times 6 = 36\) years.
Consider ages at the time of marriage:
Let the marriage have taken place \(y\) years ago.
At the time of marriage, the man's age was \(42 - y\) years.
At the time of marriage, the wife's age was \(36 - y\) years.
Formulate equation from marriage ratio:
The ratio of their ages at the time of marriage was 4 : 3. So,
Solve for \(y\):
Cross-multiply the equation:
\(3(42 - y) = 4(36 - y)\)
\(126 - 3y = 144 - 4y\)
\(4y - 3y = 144 - 126\)
\(y = 18\)
Conclusion:
They got married 18 years ago from now.
Correct Option: A) 18 years
To find the fourth proportional of three given numbers, we first substitute the given value of \(x\) into each expression to find the actual numbers. Then, we use the property of proportion that states if \(a, b, c, d\) are in proportion, then the ratio of the first two is equal to the ratio of the last two, i.e., \(a:b = c:d\) or \[\frac{a}{b} = \frac{c}{d}\]. From this, we can find the fourth proportional \(d\).
Thus, the fourth proportional is 3.
D) 3 is the correct answer. After substituting \(x=3\) into the expressions, we get the numbers \(24, 8, 9\). Setting up the proportion \(24:8::9:P\) and solving for \(P\) yields \(P=3\).
This is a syllogism problem. We will use Venn diagrams to represent the given statements and then evaluate each conclusion based on these diagrams.
Statement 1: All parrots are doves.
This means the set of Parrots is entirely contained within the set of Doves.
Diagram: (Parrots \(\subset\) Doves)
Statement 2: No dove is canary.
This means the set of Doves and the set of Canaries are mutually exclusive (they do not overlap).
Diagram: (Doves \(\cap\) Canaries = \(\emptyset\))
Statement 3: All flamingoes are canaries.
This means the set of Flamingoes is entirely contained within the set of Canaries.
Diagram: (Flamingoes \(\subset\) Canaries)
Combining the diagrams:
This implies that Parrots and Flamingoes are also separate, as Parrots are within Doves, and Flamingoes are within Canaries, and Doves and Canaries have no common elements.
Evaluating the Conclusions:
Conclusion I: Some flamingoes are parrots.
From our combined diagram, Flamingoes are inside Canaries, and Parrots are inside Doves. Since Doves and Canaries are entirely separate, Flamingoes and Parrots must also be entirely separate. Therefore, this conclusion does not follow.
Conclusion II: No canary is parrot.
We know that 'No dove is canary' and 'All parrots are doves'. If no dove is a canary, and all parrots are doves, then it logically follows that no parrot can be a canary. Therefore, this conclusion follows.
Conclusion III: No parrot is flamingo.
We established that Parrots are within Doves, and Flamingoes are within Canaries. Since Doves and Canaries are disjoint, Parrots and Flamingoes must also be disjoint. Therefore, this conclusion follows.
Conclusion IV: Some canaries are parrots.
As established in Conclusion II, 'No canary is parrot'. If no canary is a parrot, then 'Some canaries are parrots' is definitely false. Therefore, this conclusion does not follow.
Thus, only conclusions II and III logically follow.
Correct Option: D) Only conclusions II and III follow.
The question asks to identify a microfinance institution in India that specializes in gold loans and offers a range of other financial services like foreign exchange, money transfer, wealth management, and travel/tourism services. This requires knowledge of the specific services offered by prominent financial institutions in India.
Correct Option: A) Muthoot Finance Ltd is a leading Non-Banking Financial Company (NBFC) in India, primarily known for its gold loan business. It provides loans exclusively against gold jewellery. Beyond gold loans, Muthoot Finance also offers a comprehensive range of financial services, including foreign exchange, money transfer services (both domestic and international), wealth management services, and even travel and tourism services. This aligns perfectly with all the services listed in the question.
On 14 February 2022, ISRO successfully launched its first earth observation satellite of 2022, EOS-04. It was launched by which rocket?
The question asks to identify the specific ISRO rocket that launched the EOS-04 satellite on February 14, 2022. This requires knowledge of ISRO's launch history and the naming conventions of its PSLV missions.
D) PSLV-C52 is the correct rocket that launched EOS-04 on February 14, 2022. This was ISRO's first launch of 2022.