
This is a syllogism problem. We need to analyze the given statements and determine which conclusions logically follow. We can use Venn diagrams or logical deduction to solve this. The key is to assume the statements are true, even if they contradict common knowledge.
A) Only conclusion (II) follows.
Study the given bar-graph and answer the question that follows. The bar-graph depicts the number of policies purchased in May, June, July and August.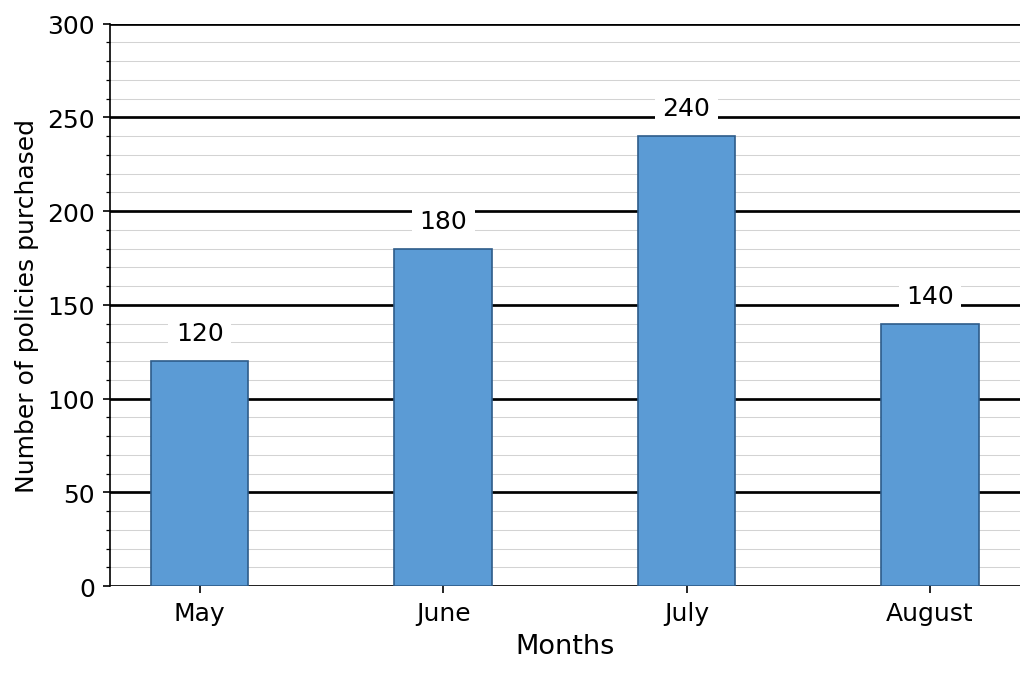
The number of policies purchased in July increased by approximately what per cent as compared to June?
To find the percentage increase in the number of policies purchased from June to July, we need to calculate the difference between the two months and then express this difference as a percentage of the June figure.
Increase = July policies - June policies = 240 - 180 = 60
Simplifying, we get:
\[ \text{Percentage Increase} = \left(\frac{1}{3}\right) \times 100 = 33.33\% \]Therefore, the increase is approximately 33%.
Correct Option: A) 33%
The problem involves a coding-decoding pattern. We need to identify the rule applied to transform the given words and then apply the same rule to the target word.
A) EJSW is the correct answer based on the derived coding pattern.
To solve this direction problem, we need to track Sohan's initial direction and then calculate the net change in his orientation due to the series of turns. Clockwise turns are positive, and anticlockwise turns are negative.
Alternatively, we can calculate the net angular displacement:
A net turn of \(-180^\circ\) means a 180° anticlockwise turn. A 180° turn (clockwise or anticlockwise) always results in facing the opposite direction.
Initial direction: North-west
Opposite of North-west is South-east.
Therefore, Sohan is facing South-east.
D) South-east
The problem presents a series consisting of a letter and a number. To find the missing term, we need to identify the pattern in both the letter sequence and the number sequence independently.
The letters are L, M, O, R, V, ?
The pattern for the letter sequence is an increment of +1, +2, +3, +4. Following this pattern, the next increment should be +5.
The numbers are 16, 20, 24, 28, 32, ?
The pattern for the number sequence is a constant increment of +4.
The next letter is A and the next number is 36. Therefore, the missing term is A 36.
D) A 36
Express 4.\(\overline{142}\) in the form \( \frac{p}{q} \), where p and q are integers and q ≠ 0.
\(\frac{4138}{999}\)
\(\frac{4136}{999}\)
\(\frac{4142}{999}\)
\(\frac{4140}{999}\)
To express a repeating decimal (non-terminating recurring decimal) in the form \(\frac{p}{q}\), we use an algebraic method. We set the given decimal equal to a variable, multiply it by powers of 10 to align the repeating part, and then subtract the equations to eliminate the repeating decimal, solving for the variable.
A) \(\frac{4138}{999}\) is the correct representation of \(4.\overline{142}\) in the form \(\frac{p}{q}\).
The question asks for the Indian state where Kamet peak is located. This requires knowledge of the geographical distribution of major Himalayan peaks within India.
C) Uttarakhand — Kamet peak, with an elevation of 7,756 meters (25,446 ft), is the second-highest mountain in the Garhwal region of Uttarakhand, India, after Nanda Devi. It is situated in the Chamoli District of Uttarakhand.
In a particular language, AC is written as 13 and FG is written as 67. How will HI be written in that language?
The problem is a coding-decoding question based on the alphabetical positions of letters. We need to identify the pattern used to convert letter pairs into numbers and then apply the same pattern to the target letter pair.
D) 89 — Based on the identified pattern, H (8) and I (9) concatenate to form 89.
Study the given pie-chart and answer the question that follows. The pie-chart depicts percentage of passes issued in 4 months, out of the total number of passes (which is 500) in these 4 months together.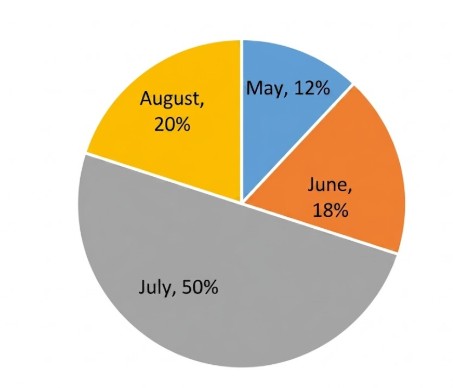
The number of passes issued to females in May and June was 3 and 5, respectively. What was the total number of passes issued to males in May and June together?
To find the total number of passes issued to males in May and June, we need to first determine the total number of passes issued in each month using the pie-chart percentages. Then, subtract the number of passes issued to females from these totals.
However, the question likely intends to find the total number of passes issued to males in May and June together considering only the difference from females, which is \( 60 - 3 + 90 - 5 = 7 \).
Correct Option: D) 7
According to ________, the Parliament amended the Constitution (42nd Constitutional Amendment) and inserted ‘Secular’, ‘Socialist’, and ‘Integrity’ in the Preamble of the Constitution.
The question asks about the constitutional provision that empowers the Parliament to amend the Constitution. Specifically, it refers to the 42nd Constitutional Amendment which added the words 'Secular', 'Socialist', and 'Integrity' to the Preamble. We need to identify the correct Article of the Indian Constitution that deals with its amendment.
C) Article 368 is the correct answer. It explicitly grants the Parliament the power to amend the Constitution and outlines the procedure for such amendments. The 42nd Constitutional Amendment Act, which inserted the words 'Secular', 'Socialist', and 'Integrity' into the Preamble, was enacted under the authority of Article 368.