
The problem asks us to find the next number in a given series: 3, 4, 10, 33, 136, ?. We need to identify the pattern or rule governing the series to determine the missing number.
Correct Option: B) 685 is the number that replaces the question mark, following the identified pattern.
The question asks to identify the Indian sector responsible for the 'One Station One Product' initiative, as mentioned in the Union Budget of India 2022-23. This requires knowledge of recent government initiatives and their associated ministries or departments.
D) railways — The 'One Station One Product' scheme was indeed launched by the Indian Railways. It aims to promote local products by making railway stations a hub for their sale, thereby boosting local economies and providing passengers with a taste of regional specialties.
The question asks to identify the institution that launched 'Swarajability', India's first AI-based job platform for persons with disabilities. This is a factual question related to recent developments in technology and social inclusion in India.
Correct Option: A) IIT Hyderabad, in collaboration with Youth4Jobs and Kotak Mahindra Bank, launched the beta version of 'Swarajability'. This platform uses Artificial Intelligence to connect persons with disabilities who are seeking employment with potential employers, providing skill training and job matching services.
To find the missing number in the series, we need to identify the pattern or rule governing the sequence of numbers. We will examine the differences between consecutive terms to uncover this pattern.
The second-level differences (4, 8, 12) form an arithmetic progression where each term increases by 4. The next term in this sequence would be \(12 + 4 = 16\).
Using the pattern from step 3, the next difference in the first-level series (2, 6, 14, 26) would be \(26 + 16 = 42\).
Add this new difference to the last known term in the original series:
\[ 60 + 42 = 102 \]C) 102 — The pattern involves a second-level difference that is an arithmetic progression with a common difference of 4. Following this pattern, the next number in the series is 102.
This is a logical reasoning problem involving scheduling exams for seven people (P, Q, R, S, T, U, V) over seven days of a week, from Monday to Sunday. We need to deduce the exam schedule based on the given clues and identify who has the exam on Monday.
First, list the days of the week:
| Day | Person |
|---|---|
| Monday | |
| Tuesday | |
| Wednesday | |
| Thursday | |
| Friday | |
| Saturday | |
| Sunday |
Use the direct clues to fill in the schedule:
| Day | Person |
|---|---|
| Monday | |
| Tuesday | P |
| Wednesday | |
| Thursday | |
| Friday | |
| Saturday | |
| Sunday | R |
Now, use the clues involving immediate succession:
| Day | Person |
|---|---|
| Monday | |
| Tuesday | P |
| Wednesday | |
| Thursday | |
| Friday | |
| Saturday | S |
| Sunday | R |
Combine the next set of clues:
| Day | Person |
|---|---|
| Monday | |
| Tuesday | P |
| Wednesday | |
| Thursday | T |
| Friday | Q |
| Saturday | S |
| Sunday | R |
Use the clue about the gap:
| Day | Person |
|---|---|
| Monday | |
| Tuesday | P |
| Wednesday | V |
| Thursday | T |
| Friday | Q |
| Saturday | S |
| Sunday | R |
Identify the remaining person and day:
Therefore, U's exam is on Monday.
| Day | Person |
|---|---|
| Monday | U |
| Tuesday | P |
| Wednesday | V |
| Thursday | T |
| Friday | Q |
| Saturday | S |
| Sunday | R |
A) U — Based on the step-by-step deduction, U is the only person remaining to have an exam on Monday.
The given bar graph shows the data of cotton exports in India from years 2018 to 2021. Study the given bar graph and answer the question.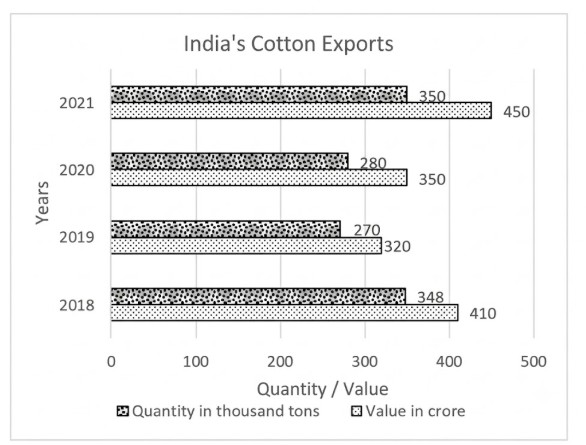
In which year was the value per thousand tons the minimum?
To determine the year with the minimum value per thousand tons of cotton exports, we need to calculate the value per unit for each year and compare them.
Correct Option: D) 2018
The given bar graph shows the data of the number of students who were called for an interview by a company ‘XYZ’ from three different institutes A, B and C over the years. Study the bar graph and answer the question.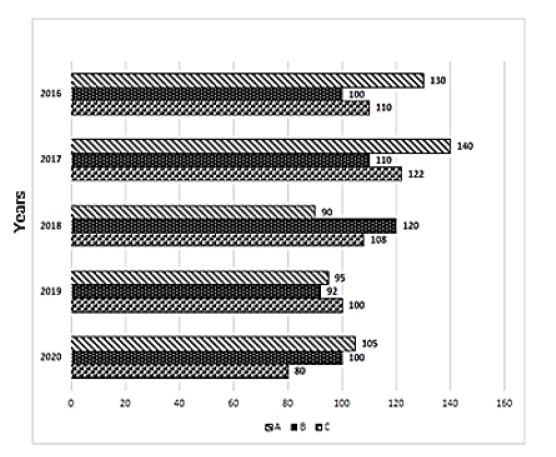
What is the ratio of the average number of students called for an interview from institute C in the period 2018 to 2020 to the average number of students called for an interview from institute B in the same period?
To find the ratio of the average number of students called for interviews from institute C to institute B over the years 2018 to 2020, we first calculate the average for each institute over these years and then compute the ratio.
Correct Option: C) 12 : 13
The question asks to identify the player with the most runs in the Indian Premier League (IPL) as of July 2022. This requires knowledge of IPL records, specifically the all-time leading run-scorers.
Correct Option: B) Virat Kohli
As of July 2022, Virat Kohli was the leading run-scorer in the Indian Premier League with 6411 runs. He has consistently been one of the top performers in the league for Royal Challengers Bangalore.
The problem involves analyzing a given inequality statement and determining the truthfulness of two conclusions based on it. We need to combine the parts of the statement to establish relationships between the variables and then check if the conclusions logically follow.
The statement is given as: \(C = U \ge G = I > R\)
This can be broken down into individual relationships:
From the above, we can write a combined chain of inequalities:
\(C = U \ge G = I > R\)
The original statement is \(C = U \ge G = I > R\). There is no variable 'H' in the given statement. This indicates a typo in the question, as 'H' is not defined. Assuming 'H' was meant to be 'I' or 'G' or 'U' or 'C' (as these are the variables in the statement), let's re-evaluate. If we assume the question meant to ask about 'I > R', then it is true based on the statement. If it meant 'G > R', it is also true because \(G = I\) and \(I > R\). If it meant 'U > R', it is true because \(U \ge G = I > R\). If it meant 'C > R', it is true because \(C = U \ge G = I > R\).
Given that the correct option is 'Both conclusions I and II are true', it implies that 'H' must be one of the variables present in the statement, and the conclusion must be true. Let's assume there's a typo in the question and 'H' should be 'I' (or any variable from C, U, G, I). If 'H' is 'I', then \(I > R\) is directly given in the statement, making Conclusion I true.
Let's assume the question intended to include 'H' as part of the statement, but it was omitted. However, based on the provided text, 'H' is not present. In competitive exams, if such a typo occurs, one usually assumes a variable from the statement or that there's an implicit connection. Given the options, let's proceed by assuming 'H' is one of the variables that would make the conclusion true, or there's a missing part of the statement that defines H. Since this is a common type of question, and usually, all variables are defined, let's re-examine the question. The question text is: "Statement: C = U G = I > R Conclusions: I. H > R II. H > C". There seems to be a missing operator between U and G, and H is undefined. This is a flawed question as written.
However, if we interpret the statement as \(C = U \ge G = I > R\), which is a common format for these types of questions (where spaces imply a continuation of the chain or a missing operator like \(\ge\) or \(\le\)), and if we assume 'H' in the conclusions is a typo for 'I' or 'G' or 'U' or 'C', let's check the options. Given the correct answer, there must be a way for both conclusions to be true. This implies that 'H' must be a variable that is greater than R and also greater than C.
Let's assume the statement was intended to be \(C = U \ge G = I\) and then a separate relation involving H. But that doesn't fit the format. A more plausible interpretation, given the common structure of these questions, is that the statement was meant to be \(C = U \ge G = I\) and then \(H > I\) (or some relation that links H). However, without H in the statement, we cannot evaluate conclusions I and II definitively.
Let's consider a common error in typing such questions where a variable might be repeated or an operator missed. If the statement was intended to be \(C = U \ge G = I > R\), and the conclusions involve 'H', it's problematic. Let's assume 'H' is a placeholder for one of the variables in the chain \(C, U, G, I\).
If we assume the question meant to include 'H' in the statement, for example, if the statement was \(C = U \ge G = I > R\) and also \(H > I\). Then \(H > I\) and \(I > R\) implies \(H > R\). Also, if \(H > I\) and \(I = G \le U = C\), then \(H\) could be greater than \(C\) if \(H\) is sufficiently large. This is highly speculative.
Let's re-read the statement carefully: "C = U G = I > R\
The question asks about the appointing authority for the Chief Justice of India. This falls under the constitutional provisions related to the judiciary in India. We need to identify the specific constitutional office responsible for this appointment.
Correct Option: D) The President of India is the constitutional authority responsible for appointing the Chief Justice of India, as per Article 124(2) of the Indian Constitution.