
The graph and the table below show the total units sold by three salesmen named Jeet, Mridul, and Shashank in three different years, i.e., 2015, 2016, and 2017. Study the graph and the table and answer the question.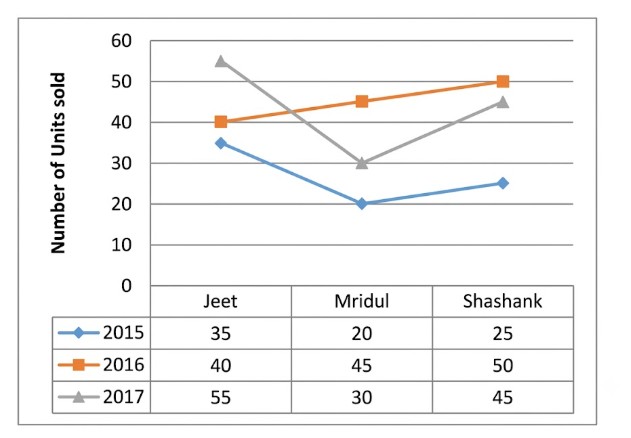
If Jeet has sold an average of 40 units in five years (from 2015 to 2019), and if the number of units sold by Jeet in 2018 and 2019 is exactly the same, how many units did he sell in the year 2018?
To find the number of units Jeet sold in 2018, we need to use the average sales data from 2015 to 2019 and the information that sales in 2018 and 2019 were the same.
\[ \text{Average} = \frac{\text{Total units sold over 5 years}}{5} \]
\[ \text{Total units sold} = 40 \times 5 = 200 \]
\[ 35 + 40 + 55 = 130 \]
\[ 130 + x + x = 200 \]
\[ 130 + 2x = 200 \]
\[ 2x = 70 \]
\[ x = 35 \]
B) 35 — Jeet sold 35 units in 2018.
A statement is given, followed by four conclusions given in the options. Find out which conclusion is true based on the given statement.
Statement:
Z > M = A < U ≥ G ≥ L = D
This problem involves analyzing a statement with inequalities and equalities to determine which of the given conclusions logically follows. We need to combine the given relationships between variables and check each option.
The given statement is: \(Z > M = A < U \ge G \ge L = D\)
Let's break down the relationships:
Now let's evaluate each option:
A) U > M
B) A = G
C) G < D
D) A > Z
Select the option that shows the correct matching of Column I with Column II regarding Asexual Reproduction.
| Column I | Column II |
| A. Leishmania | i) Regeneration |
| B. Yeast | ii) Binary fission |
| C. Plasmodium | iii) Multiple fission |
| D. Hydra | iv) Budding |
A-ii, B-iv, C-iii, D-i
A-ii, B-i, C-iii, D-iv
A-i, B-ii, C-iii, D-iv
A-iv, B-ii, C-i, D-iii
The question asks to match organisms with their respective modes of asexual reproduction. To answer this, we need to recall the common asexual reproduction methods for each organism listed in Column I.
Based on this analysis, the correct matching is: A-ii, B-iv, C-iii, D-i.
A) A-ii, B-iv, C-iii, D-i is the correct match.
The question asks to identify which of the given scriptures is NOT a part of Vedic literature. To answer this, we need to recall the main components of Vedic literature and then identify the option that falls outside this classification.
Correct Option: C) Pitakas is not a part of Vedic literature. It refers to the sacred texts of Buddhism (Tripitakas).
P, Q, R, S, T, U and V were seven kids sitting around a square table, facing the centre. Three of them were sitting at the corners, while four others were sitting at the exact centre of the sides. One of the corners was empty. U, sitting at one of the centres of the sides, was second to the right of T. There was one empty chair between P and U. R and Q were diagonally opposite to each other. T was at the immediate left of Q. S was to the immediate left of V.
Who among the following was the kid at a corner position?
This is a seating arrangement puzzle. We need to deduce the positions of seven kids (P, Q, R, S, T, U, V) and one empty chair around a square table based on the given clues. Three kids are at corners, and four are at the center of the sides. One corner is empty. We will use a step-by-step method to place each person and the empty chair.
Let's consolidate the arrangement based on the clues:
Let's visualize the table:
      C1 (T)
     /    \
   S4      S1 (Q)
  |          |
   S3 (R)  S2 (U)
     \    /
      C3    C2
Remaining positions: C2, C3, C4 (one of which is empty), and S4.
Consider the empty chair between P and U. U is at S2. The positions next to U are C2 and C3. If the empty chair is at C2, then P is at C3. If the empty chair is at C3, then P is at C2.
Let's try Case 1: Empty chair at C2, P at C3.
Positions filled: T(C1), Q(S1), U(S2), R(S3), P(C3). Empty(C2).
Remaining for S and V: S4 and C4.
S is to the immediate left of V.
If V is at C4, then S is at S4. This fits.
So, the arrangement is: T(C1), Q(S1), U(S2), R(S3), P(C3), S(S4), V(C4). Empty(C2).
In this arrangement, T, P, V are at corners. C1, C3, C4 are occupied corners. C2 is the empty corner. This matches the condition that three are at corners and one corner is empty.
Let's check Case 2: Empty chair at C3, P at C2.
Positions filled: T(C1), Q(S1), U(S2), R(S3), P(C2). Empty(C3).
Remaining for S and V: S4 and C4.
S is to the immediate left of V.
If V is at C4, then S is at S4. This fits.
So, the arrangement is: T(C1), Q(S1), U(S2), R(S3), P(C2), S(S4), V(C4). Empty(C3).
In this arrangement, T, P, V are at corners. C1, C2, C4 are occupied corners. C3 is the empty corner. This also matches the condition.
Both cases lead to a valid arrangement. Let's re-examine the question: "Who among the following was the kid at a corner position?"
In both valid arrangements, the kids at corner positions are T, P, and V. The empty chair is also at a corner.
Let's list the positions of kids and empty chair:
Arrangement 1:
Corners: T, P, V, Empty
Side Centers: Q, U, R, S
Arrangement 2:
Corners: T, P, V, Empty
Side Centers: Q, U, R, S
In both valid arrangements, T, P, and V are the kids sitting at corner positions. The options are T, S, U, V.
From the options, T and V are at corner positions. S and U are at side center positions.
Since V is one of the options and is consistently at a corner position in both valid arrangements, it is the correct answer.
D) V is at a corner position in all valid arrangements derived from the clues.
A neutralisation reaction typically involves an acid and a base reacting to form a salt and water. We need to identify an acid and a base that will produce lithium sulphate (\(\text{Li}_2\text{SO}_4\)) and water (\(\text{H}_2\text{O}\)).
Find the median of:
| CI | 0-10 | 10-20 | 20-30 | 30-40 | 40-50 | 50-60 | 60-70 |
| F | 2 | 4 | 7 | 9 | 10 | 12 | 6 |
To find the median of grouped data, we first need to calculate the cumulative frequencies. Then, we determine the median class using the formula for the median position. Finally, we apply the median formula for grouped data.
| Class Interval (CI) | Frequency (F) | Cumulative Frequency (CF) |
|---|---|---|
| 0-10 | 2 | 2 |
| 10-20 | 4 | 2 + 4 = 6 |
| 20-30 | 7 | 6 + 7 = 13 |
| 30-40 | 9 | 13 + 9 = 22 |
| 40-50 | 10 | 22 + 10 = 32 |
| 50-60 | 12 | 32 + 12 = 44 |
| 60-70 | 6 | 44 + 6 = 50 |
The total frequency \(N = \sum F = 50\).
The median position is given by \(\frac{N}{2}\).
\[ \frac{N}{2} = \frac{50}{2} = 25 \]The median class is the class interval whose cumulative frequency is just greater than or equal to the median position (25). From the table, the cumulative frequency just greater than 25 is 32, which corresponds to the class interval 40-50. So, the median class is 40-50.
The formula for the median is:
\[ \text{Median} = L + \left( \frac{\frac{N}{2} - CF}{f} \right) \times h \]Thus, the median is 43.
B) 43 is the correct median calculated using the grouped data formula.
Given the following letter series, answer the question:
G Y A B B R I B R X M R A Y E J S F U Y H U Y H N E P Q S D A I
How many letters are there which are immediately preceded by a consonant and immediately followed by a vowel?
The question asks for an alternative name for the East India Company Act, 1813. This requires knowledge of the historical nomenclature of British parliamentary acts related to India.
B) Charter Act. The East India Company Act, 1813, is indeed one of the series of acts known as Charter Acts, which periodically renewed the East India Company's charter and regulated its affairs.
The question asks why plants have low energy needs. We need to evaluate each option based on biological principles related to plant physiology and energy consumption.
Correct Option: D) Because they have a lot of dead cells
Plants, particularly trees, have a large proportion of their body mass consisting of dead cells, such as those found in wood (xylem) and bark. These dead cells primarily provide structural support and transport water and nutrients, but they do not perform active metabolic processes that require energy. In contrast, living cells constantly require energy for maintenance, repair, and metabolic activities. The presence of a significant amount of metabolically inactive dead tissue reduces the overall energy demand of the plant, contributing to its lower energy needs compared to animals, which are composed almost entirely of living, metabolically active cells and often expend considerable energy on locomotion.